Measuring Income Inequality by using Lorenz Curve, Gini index or Gini coefficient
The Gini coefficient is an important statistical measure of distribution developed by the Italian statistician Corrado Gini in 1912 for analyzing income or wealth distribution within a country or region. Range: The coefficient ranges from 0 (or 0%) to 1 (or 100%), with 0 representing perfect equality and 1 representing perfect inequality.
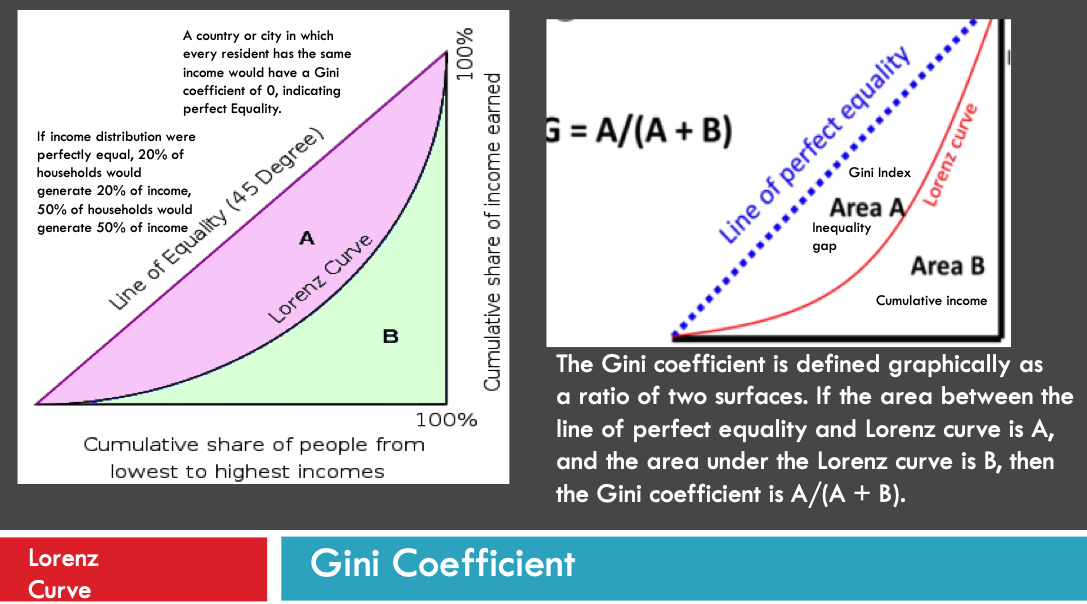
Perfect equality line: If income distribution were perfectly equal, 20% of households would generate 20% of income, 50% of households would generate 50% of income, 80% of households would generate 80% of income, and so on. This situation where each element has an equal value in its shares of X and Y generates a linear relationship by generating a perfect equality line.
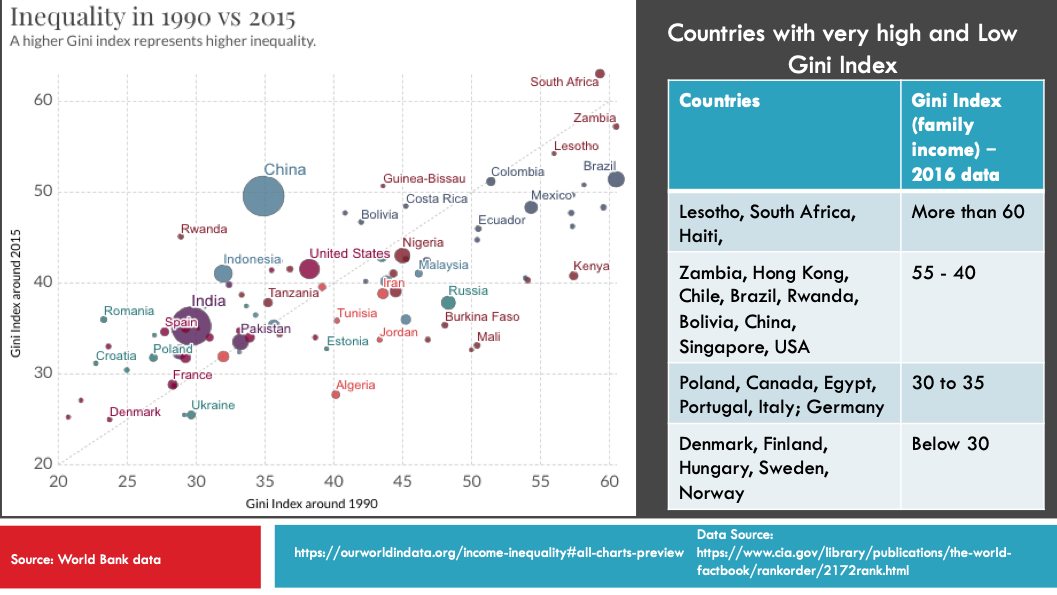
Interpretation: A higher Gini index indicates greater inequality, with high income individuals receiving much larger percentages of the total income of the population. A country or city in which every resident has the same income would have a Gini coefficient of 0, indicating perfect Equality. On the other hand, a country or city in which one resident earned all the income, while everyone else earned nothing, would have an income Gini coefficient of 1, indicating perfect inequality. While most developed European nations tend to have Gini coefficients between 0.24 and 0.36, the United States Gini coefficient is above 0.4, indicating that the United States has greater inequality. Be careful: A high-income country and a low-income one can have the same Gini coefficient, as long as incomes are distributed similarly within.
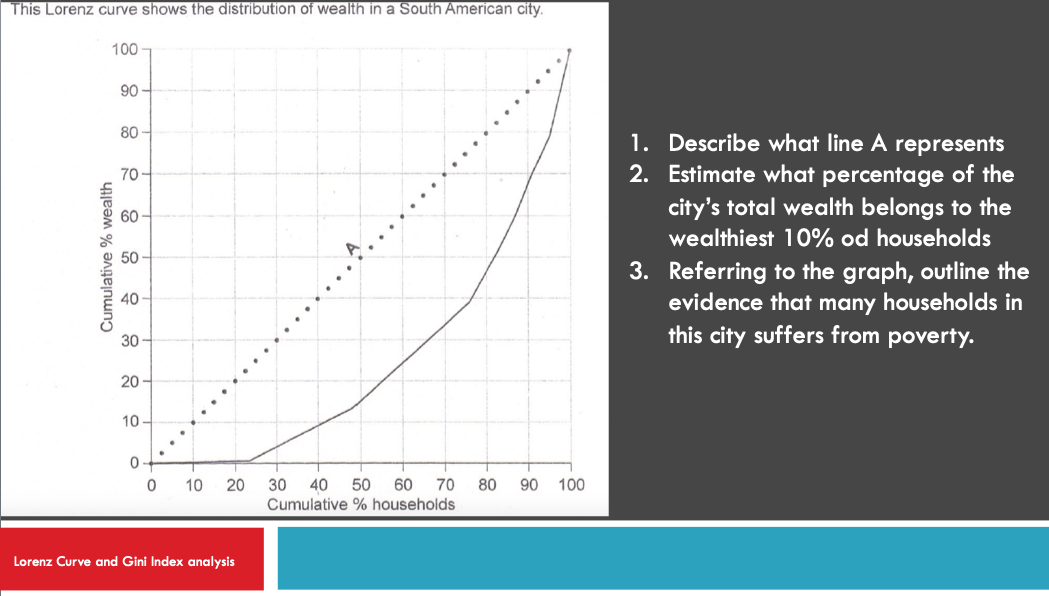
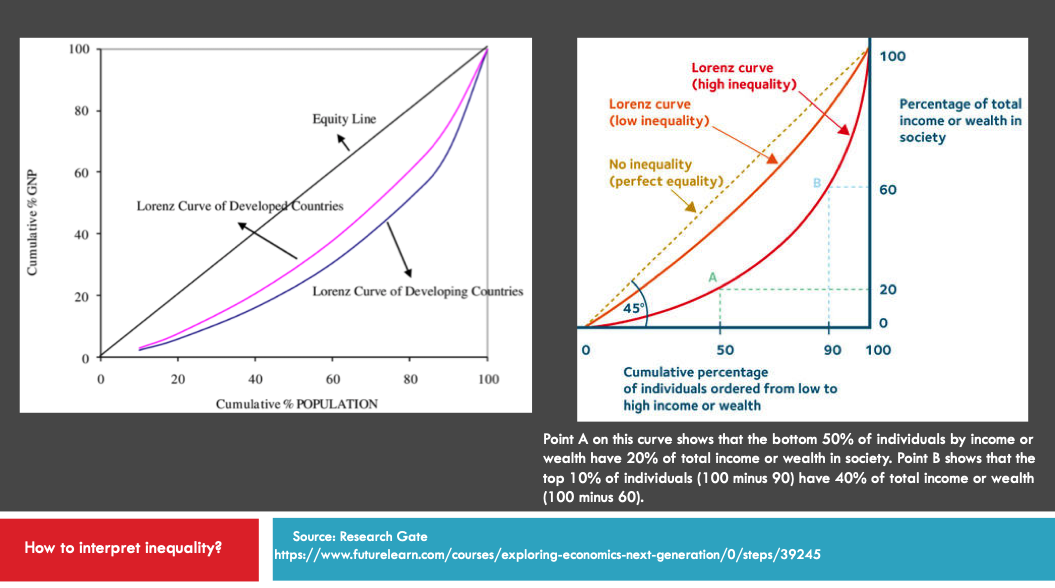
Lorenz Curve and Gini coefficient: is the graphical representation of Gini Index. Cumulative percentage of households or population is plotted on the horizontal (X) axis while cumulative income or cumulative percentage of wealth is plotted on the vertical axis (Y). To build the Lorenz curve, all the elements of a distribution must be ordered from the most important (highest) to the least important (lowest). The Gini coefficient is defined graphically as a ratio of two surfaces. If the area between the line of perfect equality and Lorenz curve is A, and the area under the Lorenz curve is B, then the Gini coefficient is A/(A + B).