
China- A transition economy? Amazing Facts about China
| Comparison between MEDC and LEDC | ||
|---|---|---|
| Development Indicators | MEDC | LEDC |
| Birth Rate | Low Less than 10 babies born per 1000 | High On an average 20-45 people born per 1000 people |
| Death Rate | Low due to good health care | High due to poor health care and widespread diseases |
| Natural increase of population | Low (below 1%) Many of the MEDCs have high elderly population causing shrinking population. | High 2-3.5% or more High youthful population. |
| Infant Mortality | The number of babies who don't survive to the age of 1 (infant) per 1,000 live births. Very low in MEDS. | A high proportion of children die before the age of 5 in LEDCs due to poor health care. WHO has estimated that around 14 children die per minute due to poor health care and lack of food in the world. |
| People per doctor | A majority of people in MEDCs have access to a doctor | Few people in LEDCs have access to a doctor unless they are wealthy |
| Life Expectancy | The average age that a person is expected to live from birth. Life expectancy is high in MEDCs due to good medical care and quality of life | Life expectancy is low in LEDCs due to poor medical care and quality of life |
| Housing | Housing in MEDCs is adequate for the majority of people. Most people have access to clean water and electricity | Housing in LEDCs is often inadequate with no access to clean running water or electricity |
| Literacy | The percentage of adults who can read and write with understanding. Literacy rates in MEDCs are high because a majority of children have access to a free education. | Literacy rates in LEDCs are low because people cannot afford to send their children to school and some areas may not even have schools due to a lack of teachers |
| GDP Gross Domestic Product (GDP) | High Is the total economic output of a country in a year. GDP per capita of the MEDC countries is more than 10000 dollars on an average. | Low GDP per capita of the LEDC countries are generally less than 10000 dollar. LDC country may have even less than 500 dollar GDP per capita. |
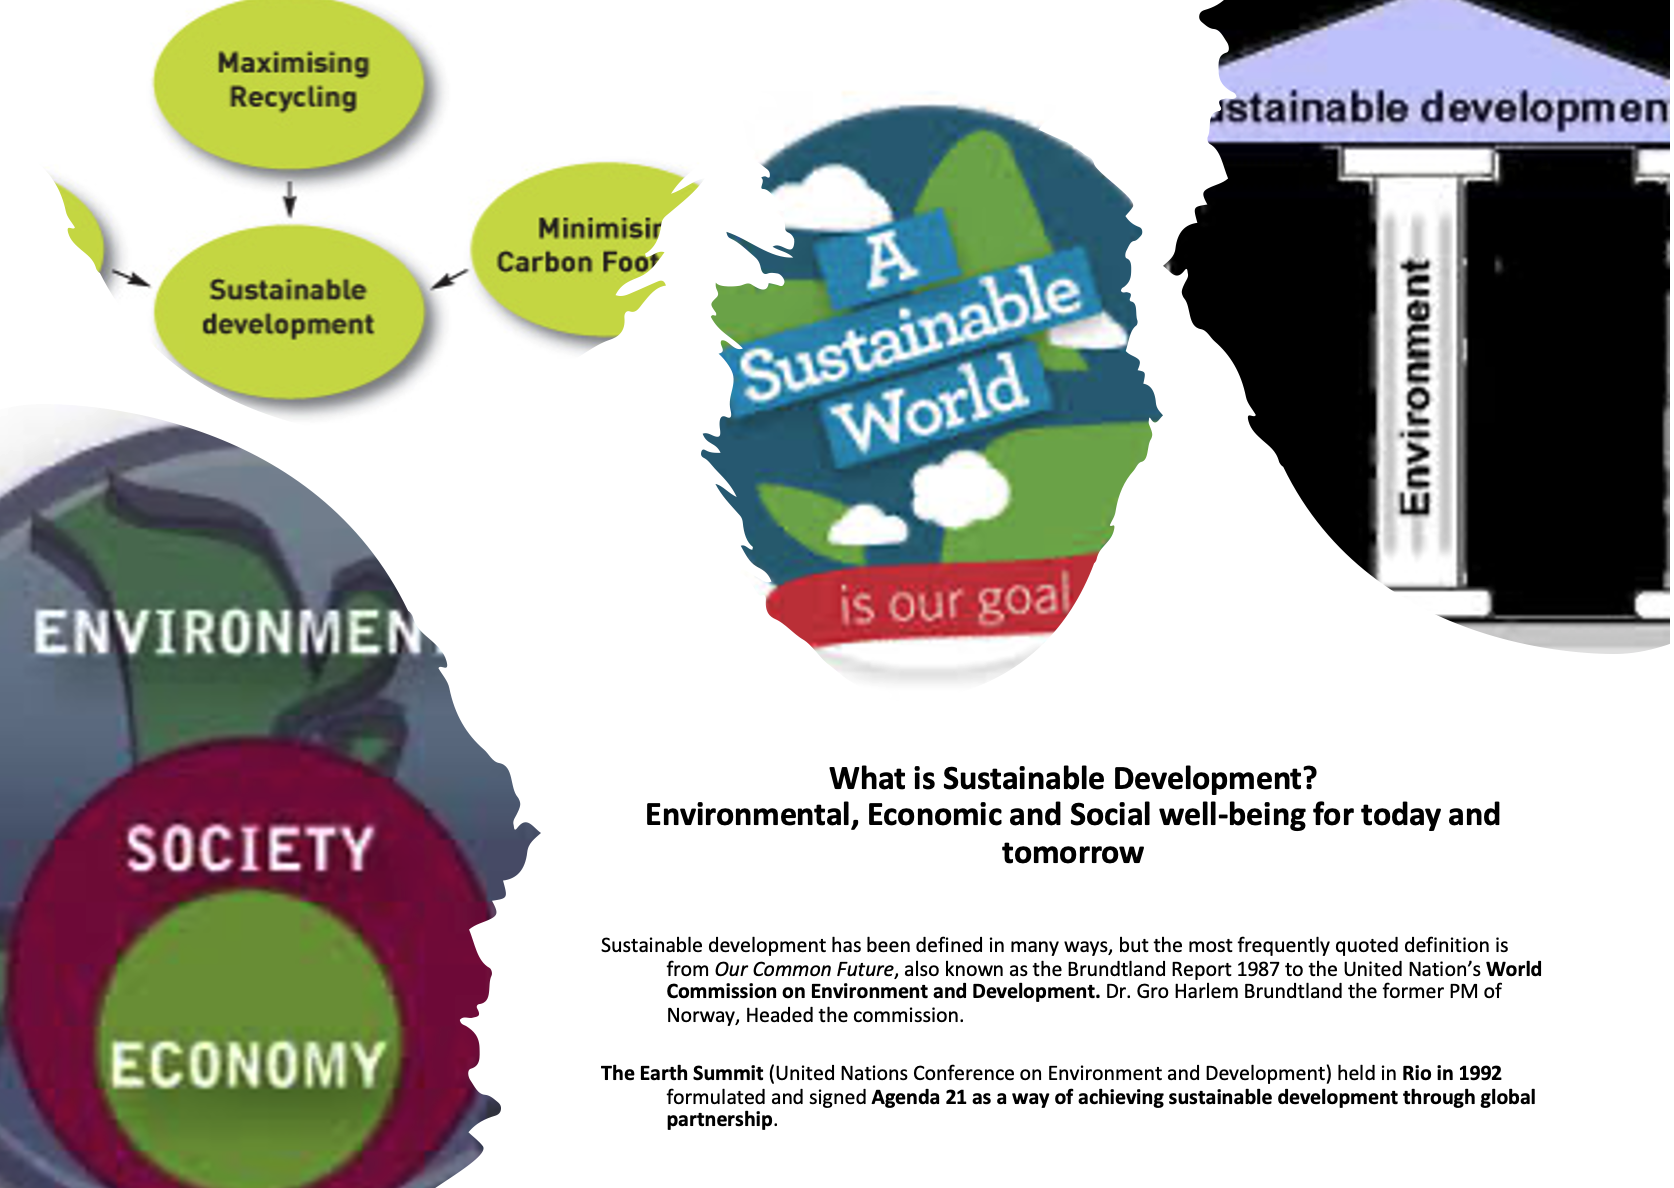
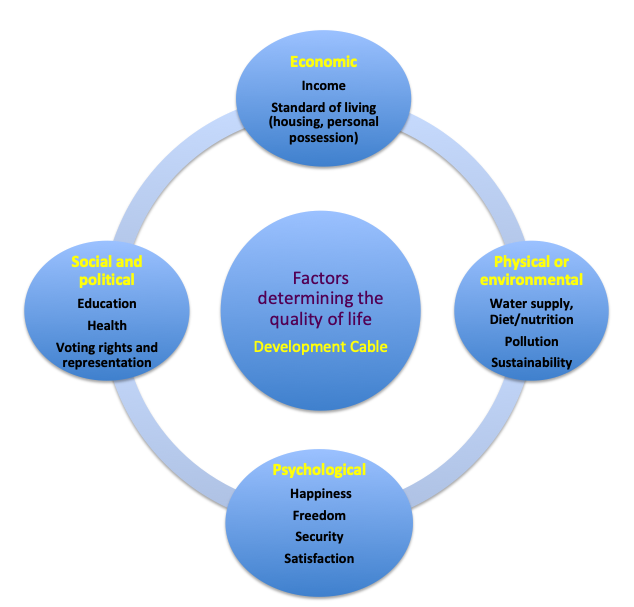
Different countries of the world are classified according to their level of social and economic development. Levels of development are dependent on physical or environmental, economic, demographic, socio-cultural and political factors. Development involves complex series of interlinked processes (refer to the development cable diagram above).
Development Gap: indicates inequality in the process of development. It denotes polarization based on ‘haves’ and ‘have nots’. Development gap may exists between countries or even within a country. Development gap could be generated due to Historical (colonial past), Physical (extreme environment, landlocked countries), economic (lack of investment and opportunities), demographic (unskilled working class, declining birth rate) or political (corruption) reasons.
| Types of indicator | Measures of development | Description | Developmental gap (based on 2019 data) |
|---|---|---|---|
| Demographic and Social | Adult Literacy | The percentage of adults who can read and write with understanding. | In 2019, global literacy rate is around 84%. Male literacy rate is 90% while female literacy rate is 83%. Many African countries still have below 50% literacy rate. One of the lowest literacy rates in the world is found in Niger, where just 20% of adults can read and write. |
| Demographic and Social | Life expectancy | The average age that a person is expected to live from birth. | According to WHO, 72 years was the average life expectancy at birth of the global population. Global life expectancy grew by 5.5 years between 2000 and 2016. he country with the highest life expectancy is Monaco at 90 years; the country with the lowest is Chad around 49 years. |
| Demographic and Social | Infant mortality Child mortality (under 5 years of age) | The number of babies who don't survive to the age of 1 (infant) per 1,000 live births. 60–80% of the infant mortality in developing countries are mostly caused by birth defects, preterm birth and low birth weight, maternal pregnancy complications. | Afghanistan recorded the highest infant mortality rate in the world, with 111 deaths per 1,000 children 5 years old and younger. Accessing healthcare in Afghanistan is very difficult for pregnant women and young babies. Monaco, a small wealthy country in Europe records the lowest count with 1.8 because of its good healthcare system and woman education. |
| Economic | GNI per capita | Gross national income per person. The value of a country's income, divided by the number of people in that country. | Qatar has the world's highest GNI per capita while Burundi and the Central African Republic have the lowest incomes out of any country in the world. Almost half of the world's population live on less than $2.50 a day. |
| Social and environmental | Access to safe clean water | The percentage of people who have access to safe, clean water for their day to day needs. | 1 in 3 people globally do not have access to safe drinking water, among whom 7 out of 10 live in rural areas and one third live in the Least Developed Countries. |
| Social and demographic | People per doctor | the number of people per doctor. A lower ratio can indicate a richer country. | Tanzania, Malawi, Niger and most of the LDCs in Africa has the lowest number of doctors per 1000 (less than 2 doctors per 100,000 people). The UK has fewer doctors per head of population than most other countries in OECD. |
| Economic and social | Unemployment rate | People as a percentage of the labour force those who are willing and available to work, but not getting a job for their qualification. | Syria at present has the highest unemployment rate at 50%. The continent of Africa registers the higher average unemployment rate of more than 20%. Most of the developed countries register below 10% unemployment rate. There are just two nations Cambodia and Thailand with unemployment rates of less than 1%, mainly because of the self employed informal sector job. |
| Social | Internet penetration rate | Percentage of the population having access to telecommunication network and technology infrastructure | The global average penetration rate was 57 percent. However, only 10 percent of the population in Somalia accessed the internet in 2019. in North Korea only 1%. only 6.2% of the World's Internet subscribers are Africans. Iceland, and Qatar, were jointly ranked first with an internet penetration of 99 percent. |
| Political | Political Transparency | Denotes openness, accountability, and honesty of the politicians. Country's voting system and the nature of democracy. | According to Corruption Perceptions Index (CPI) ranking Denmark and New Zealand, Finland, Sweden are perceived as the least corrupt countries in the world where as Somalia, North Korea, South Sudan and Yemen are perceived as the most corrupt countries in the world. |
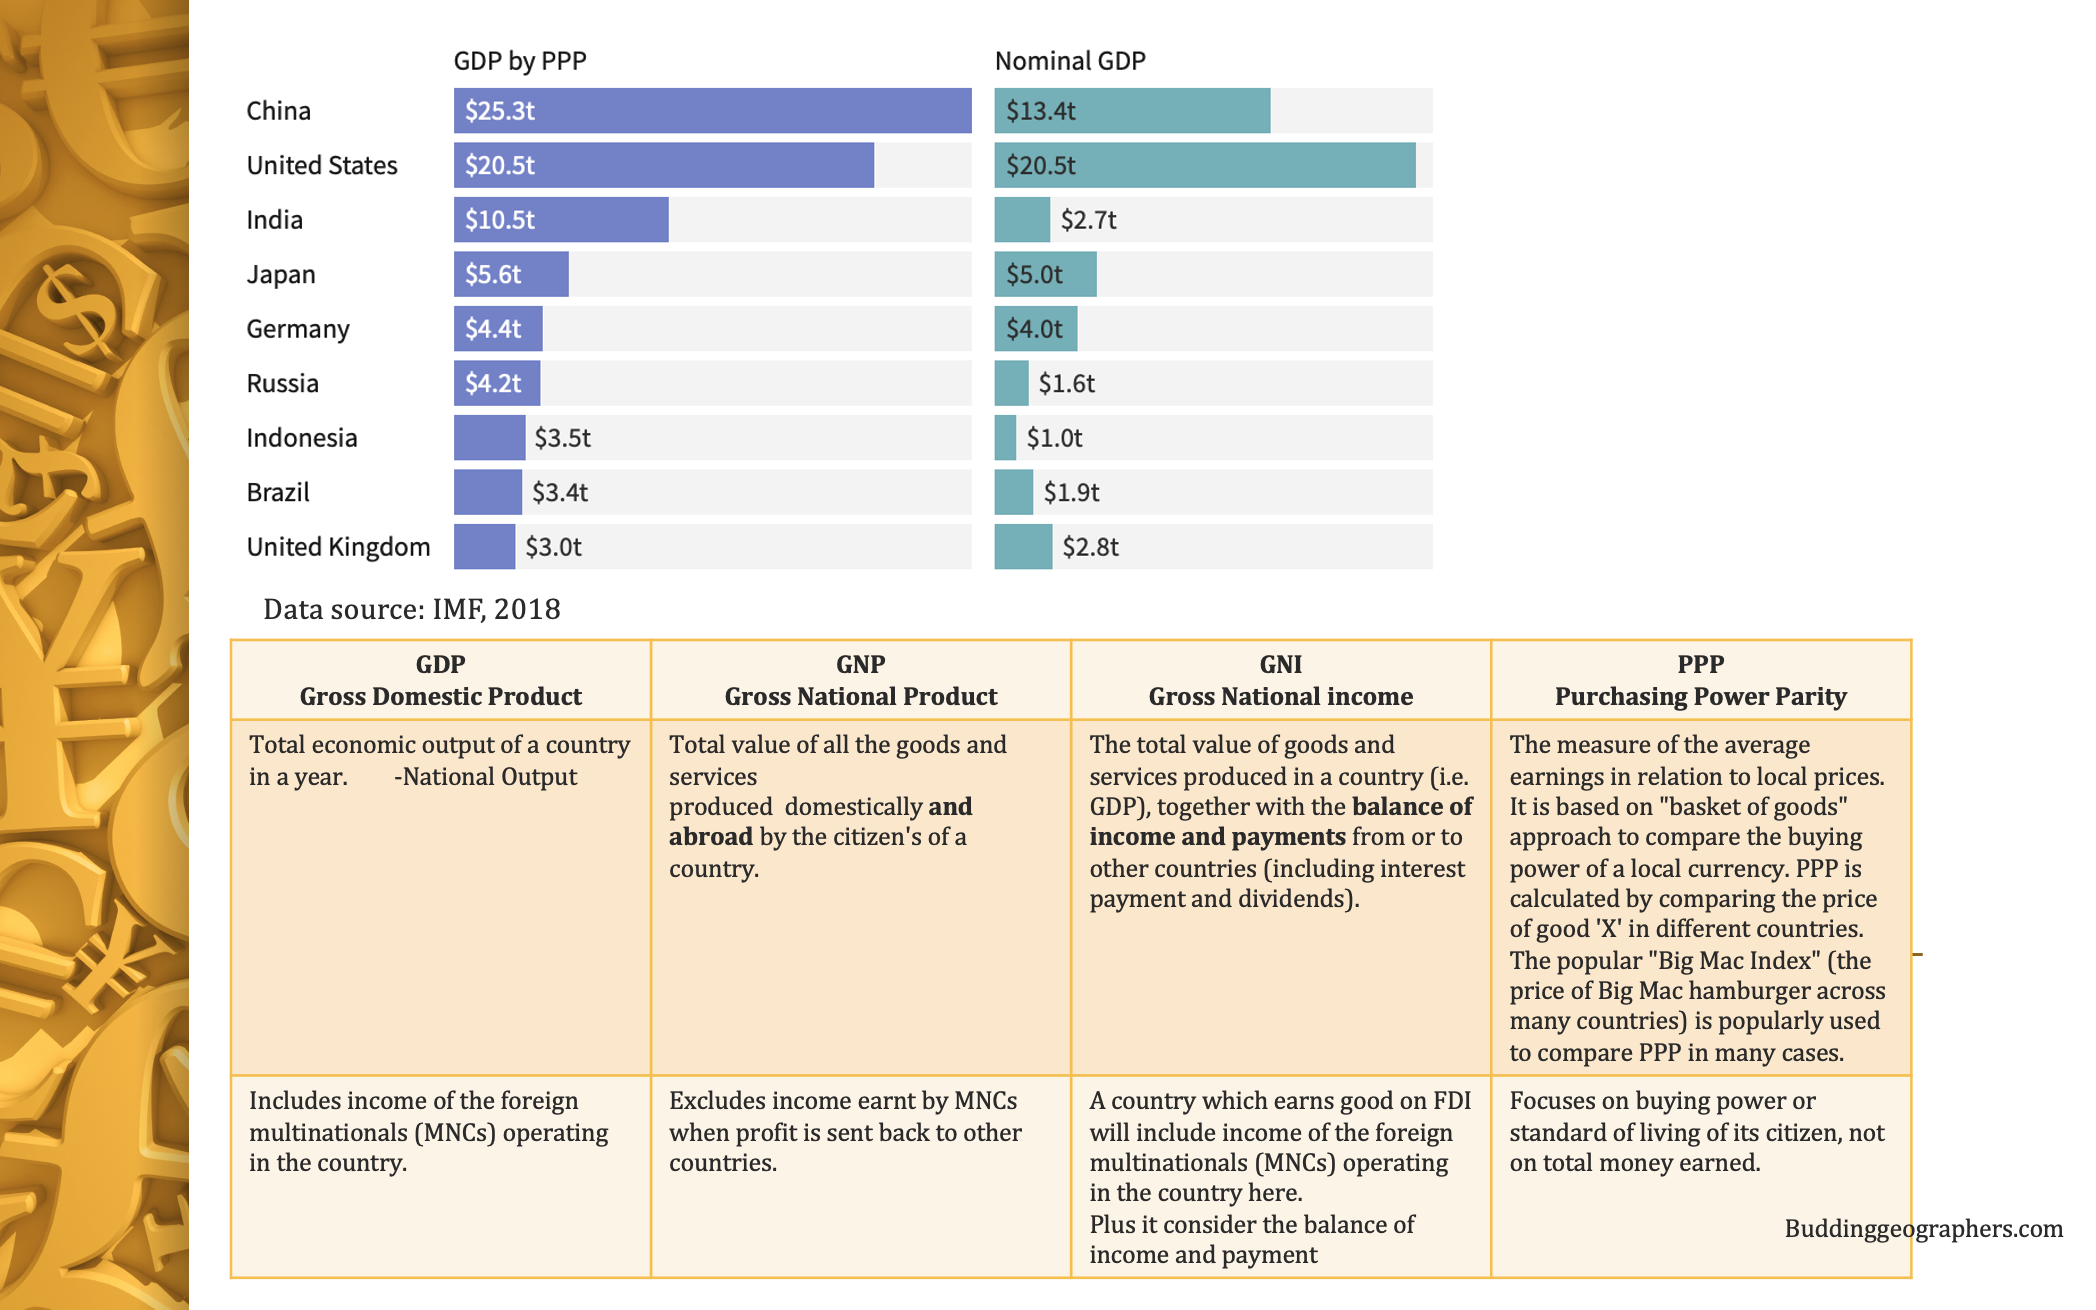

Gross Domestic Product (GDP) is the total economic output of a country in a year. It is the total value of all final goods and services produced within an economy over a period of time, usually a year. GDP is an indicator of the local/national economy.
GDP per capita to understand how the wealth is distributed within the population, however as it is an average, extreme rich and poor will be neutralized by the result. GDP per capita is the total output divided by the total number of people or population, i.e. the average amount of money each person makes.
Gross National Product (GNP): GNP is the total value of all the goods and services produced domestically and abroad by the citizen’s of a country. GNP represents how the nationals of a country are contributing to the country’s economy giving importance to citizenship but overlooks location.
Gross National Income (GNI): The total value of goods and services produced in a country (i.e. GDP), together with the balance of income and payments from or to other countries (including interest payment and dividends). GNI per person provides a better picture of the wealth distribution.
Better solution to GNI measure is to consider GNI at PPP:
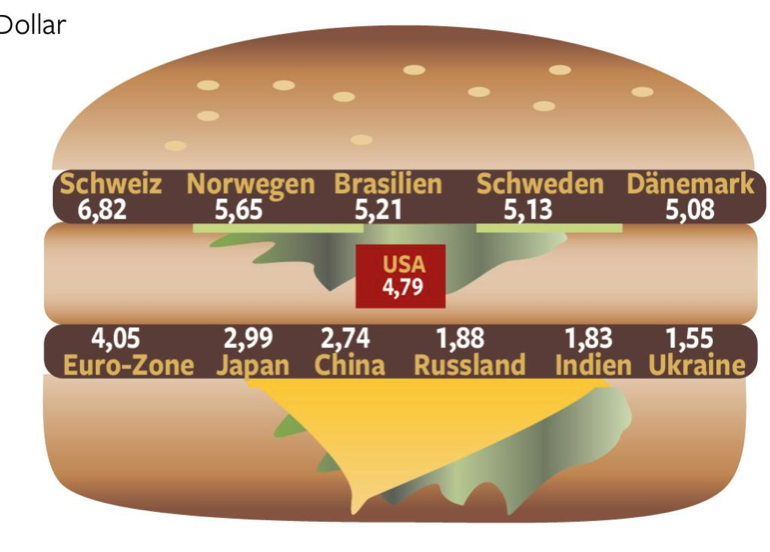
Purchasing power parity (PPP): Is the measure of the average earnings in relation to local prices (i.e. how much one can buy in local currency equivalent to 1 dollar). PPP is a macroeconomic approach to compare economic productivity and standards of living between countries. It is based on “basket of goods” approach to compare the buying power of a local currency. The GNI of a country is converted into US dollars on the basis of how the value of a currency can be compared to other countries in relation to the buying power of the currency. PPP is calculated by comparing the price of good ‘X’ in different countries. To make a meaningful comparison of prices across countries, a wide range of goods and services must be considered. The popular “Big Mac Index” (the price of Big Mac hamburger across many countries) is popularly used to compare PPP in many cases.
Click here to see Ranking of world’s Economies based on GDP and PPP
and ranking of the countries based on GDP per capita in 2019
Why only economic indicator is not reliable to measure development or disparities?
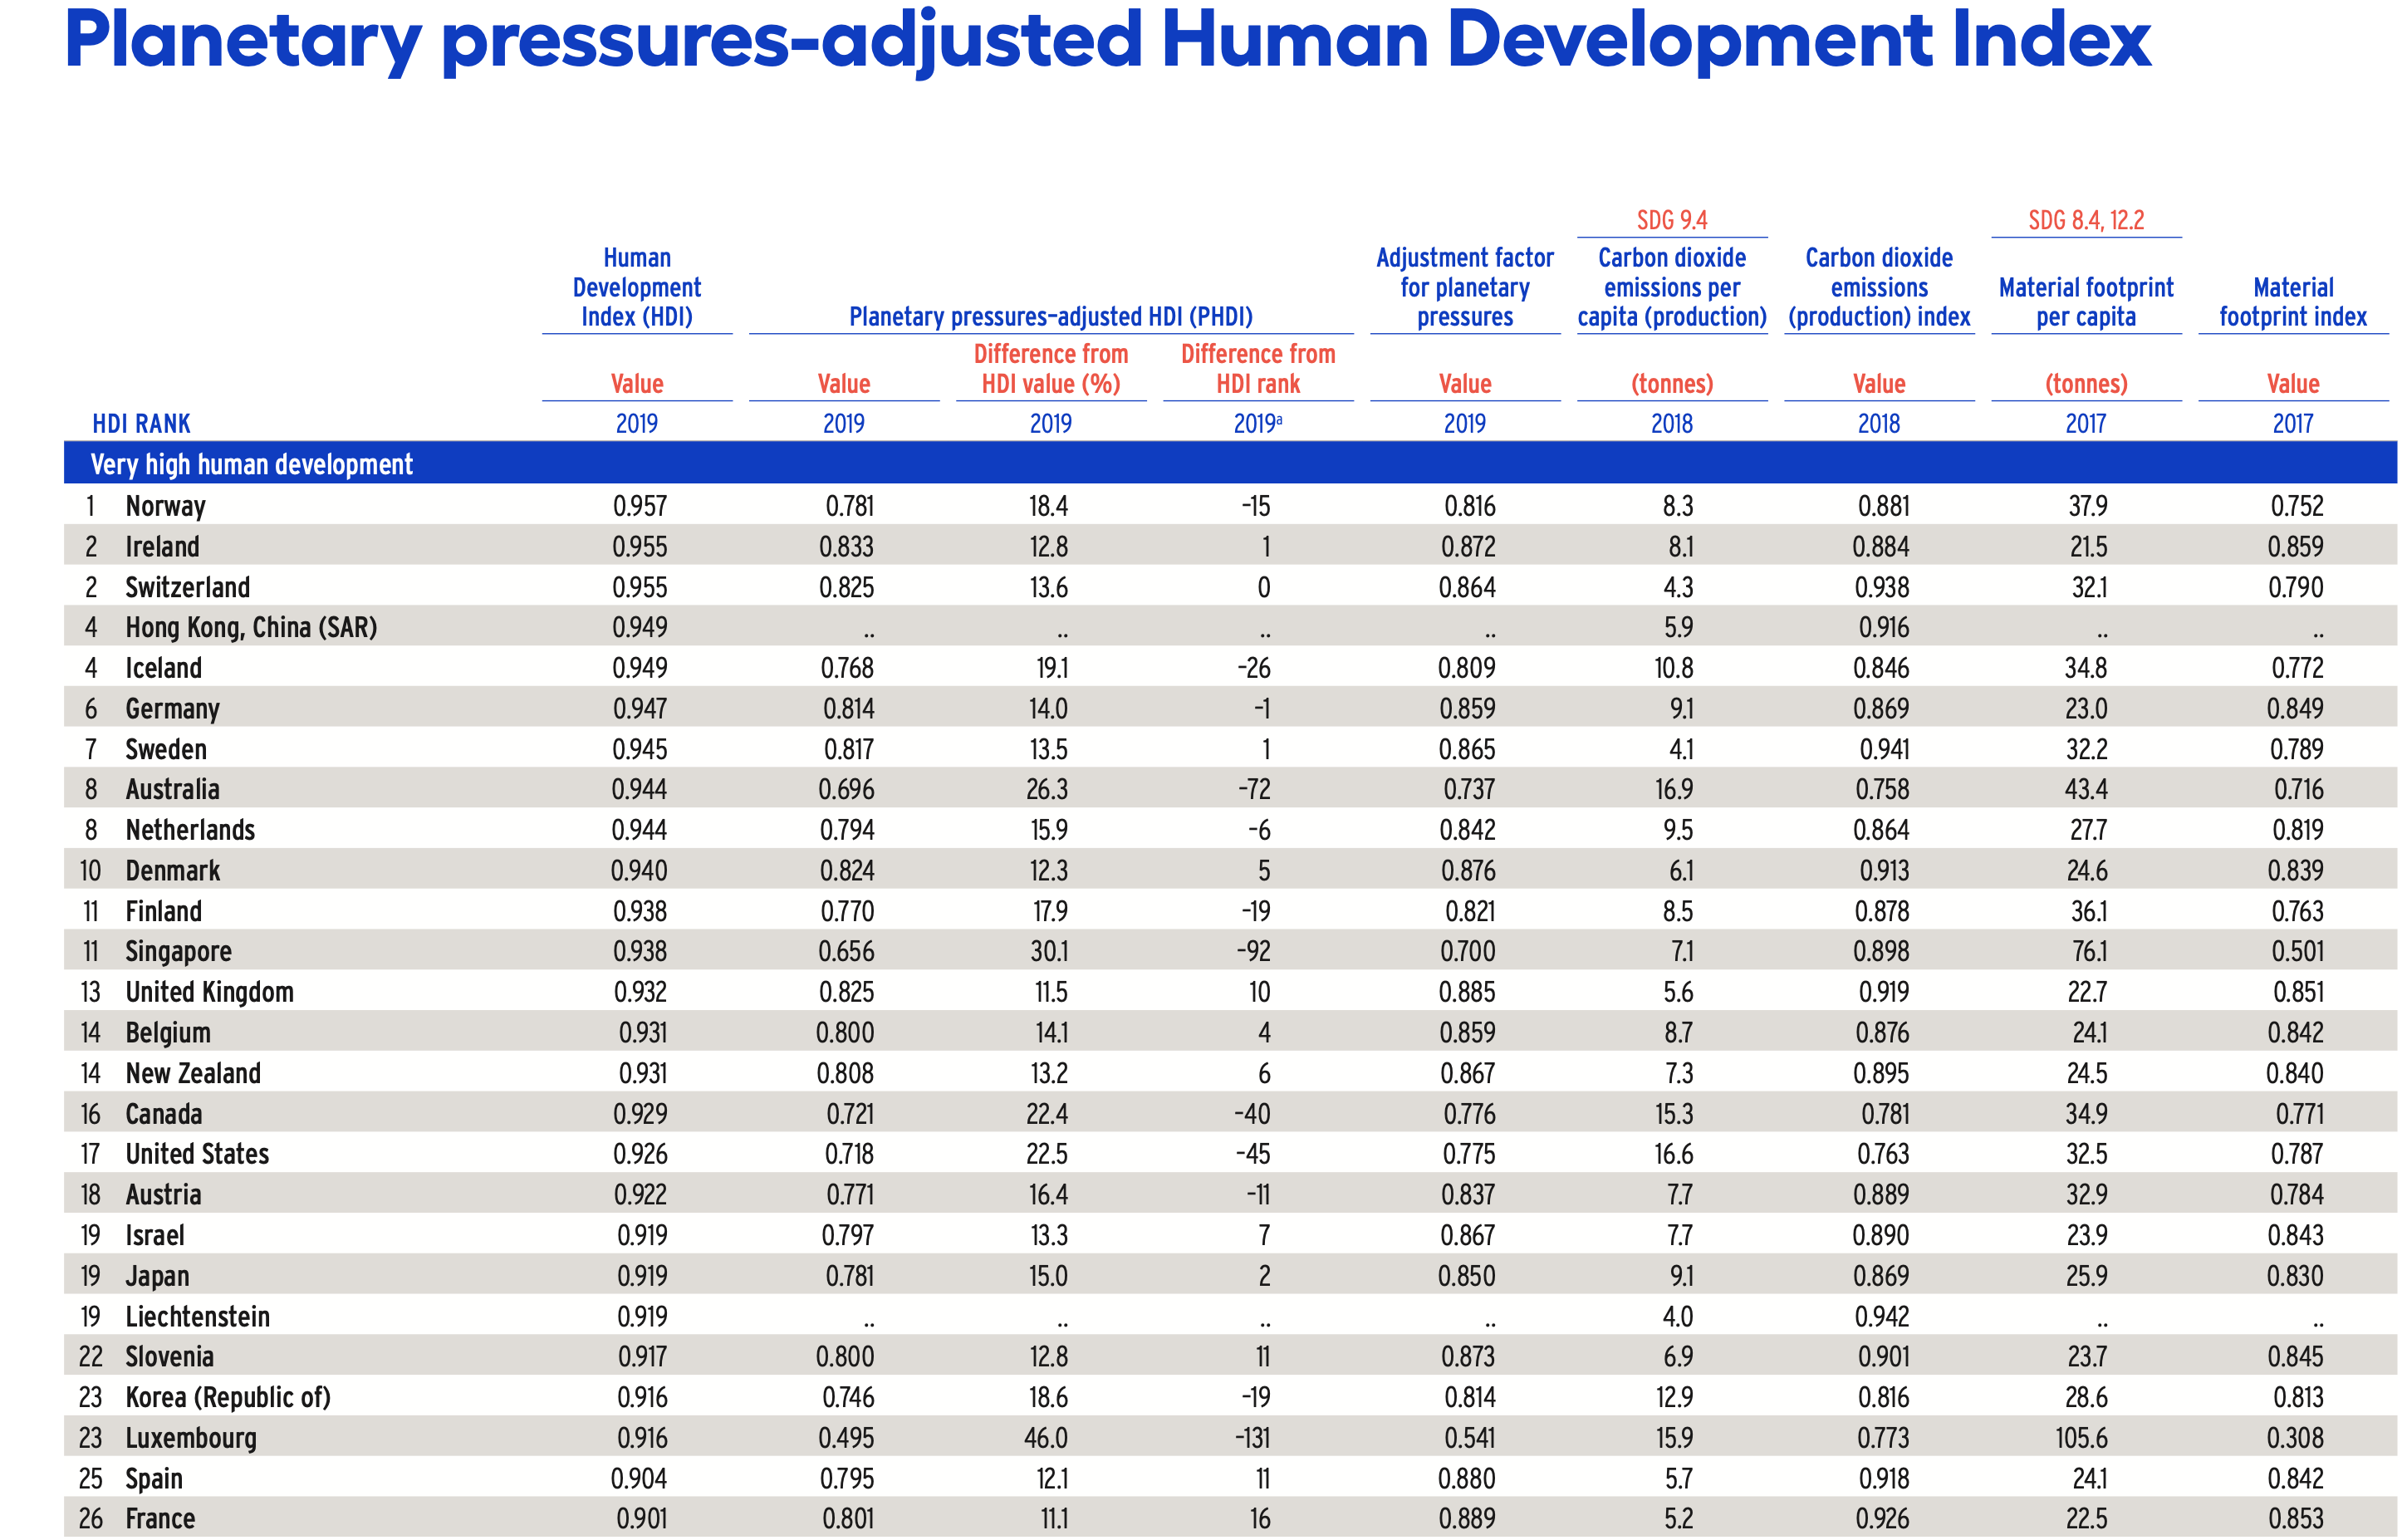
HDI was devised by the United Nations Development Programme (UNDP) in 1990s and has been in use in its current form since 2010. HDI is a composite indicator that ranks countries from 0 to 9 index values based on the following criteria.
Economic Criteria : Gross National Income per capita adjusted for purchasing power parity
Social Criteria: life expectancy and literacy.
With more than 0.9 index value Norway, Switzerland, Australia, Ireland and Germany are the top rankers in 2018 HDI report. On the other hand, with 0.3 HDI index values Niger, Central African Republic, South Sudan, Chad and Sierra Leone rank the lowest.
Classification of production into different sectors
| Primary Sector | Extraction of raw materials from the nature e.g. agriculture, fishing, farming, forestry and mining etc. |
| Secondary Sector | Transforming raw materials into semi-finished goods or finished goods. This sector includes metal working and smelting, automobile production, textile production, chemical and engineering industries, aerospace manufacturing, energy utilities, engineering, breweries and bottlers, construction, and shipbuilding. |
| Tertiary Sector | Provision of services to businesses and consumers. Activities associated with this sector include retail and wholesale sales, transportation and distribution, entertainment (movies, television, radio, music, theatre, etc.), restaurants, clerical services, media, tourism, insurance, banking, healthcare, and law. In most developed and developing countries, a growing proportion of workers are devoted to the tertiary sector. In the U.S., more than 80% of the labor force is tertiary worker. |
| Quaternary Sector | Research and development, This sector is said to be that of intellectual organization in a society such as research organization, cultural programs, information technology (IT), higher education, and libraries. |
| Quinary Sector | Highest levels of decision making in a society or economy. Top executives (CEOs) or officials in senior management in different organization as in government (Ministers, diplomats), Universities (Head of the organization) etc. |
What is globalization: “The growing interdependence of countries worldwide through the increasing volume and variety of cross border transactions in goods and services and of international capital flows, and through the more rapid and widespread diffusion of technology” (source: IMF).
It is a process that erodes national boundaries, integrates national economies, culture, technologies and governance, and produces complex relations of mutual interdependence.
Transnational Corporation or Transnational enterprise (TNC/MNC): A trans or multinational enterprise is a company or firm that has established production or other operations in more than one country through foreign direct investment. According to World Investment Report 2017, there are more than 82000 TNCs worldwide with more than 800000 foreign affiliates. Top 20 world largest corporations in 2017 are mostly American, Chinese, Japanese and French and German.
| Global Impacts | 1. Enhancement of world trade and growing power of TNCs and large brands. 2. Increasing interdependence and complexity of the global economy. FDI, outsourcing, role of the trading bloc such as EU, mass scale production are gaining more importance. 3. Cultural diffusion through labour movement, international tourism and migration playing a great role in the development of a hybrid global culture. 4. World is becoming a 'Global village' through high end connectivity and diffusion of internet technology. 4. Development of the civil society to safe guard interest such as Greenpeace. 5. Emergence of increasing number of NICs 6. Increasing cultural diversity within a country. |
|---|---|
| National level | 1. Increasing transboundary pollution for example Fly-tipping (illegal deposit or dumping of waste). 2. International tourism as rise of mass tourism. 3. Concern about loss of sovereignty (autonomous decision making power of a country). 4. Growth of anti-globalization movement as an overreaction to loss of jobs to international labour and increasing cultural diversity diluting national identity. 5. Repatriation of TNCs profit (not paying taxes to the local authority). 6. Rise of Alpha cities as global hubs. |
| Local | 1. Unemployment, uncertainty and loss of jobs due to the operation of the large global TNCs. Small local businesses find it difficult to compete with the large TNCs. 2.Rise of multicultural communities and cuisine. 3. Development of ethnic villages within cities such as China town in many megacities. 4. Creation of consumer culture and acceptance of global brands such as McD, Apple, Nike etc. 5. More connectedness through global social media such as facebook, instagram etc. |