Prev
Next


Population momentum refers to population growth or decline, which continues despite the falling or rising birth or fertility rate. Population momentum is the propensity for a growing population to continue growing even through fertility or birth rate is declining (positive momentum). On the other hand, it also includes the tendency for a population to continue to fall despite a rise in birth rate (negative momentum).
Population momentum naturally occurs towards the end of stage 3 of demographic transition. Even though the birth rate may be falling in a country, the natural increase in terms of total number may be rising due to population momentum. Positive momentum is typical for a stage 3 to 4 country in demographic transition with high base of youthful population. Negative momentum has been observed in case of the stage 5 countries with high numbers of elderly population.
Your Classwork
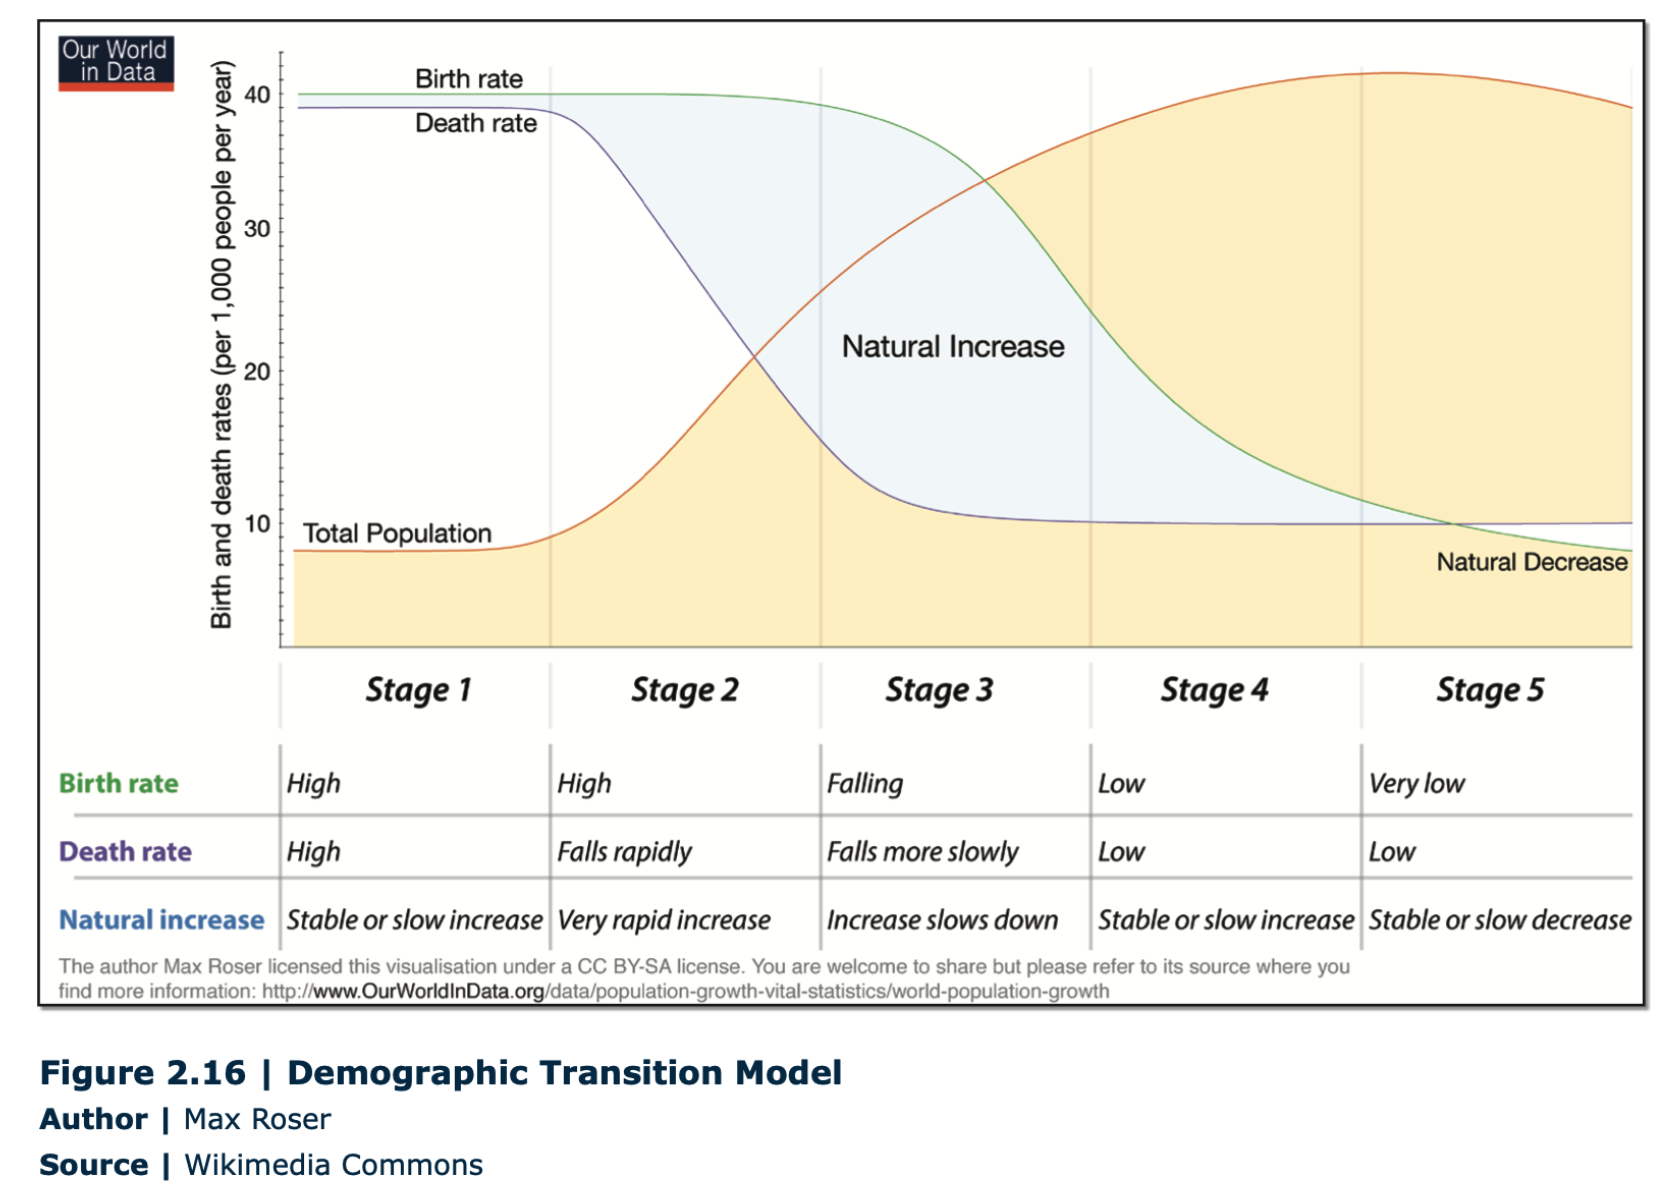
The Demographic Transition Model was developed by the American demographer Warren Thompson in 1929. DTM depicts the demographic history of a country. It refers to the transition from high birth and high death rates to low birth and low death rates regime as a country develops from a pre-industrial to an industrialized economic system.
The five stages of the demographic transition model
Stage One: The Pre-Industrial Stage (highly fluctuating – high stationary)
Example: No country as a whole at present retains the characteristics of stage 1. However, it applies only to the most remote societies on earth such as the isolated tribes in Amazon with little or no contact with the outside world.
All human populations are believed to have had this stage until the late 18th century, when many countries in Western Europe were able to cross this stage.
Stage Two: The Industrial Revolution (early expanding) –very rapid increase
Example: poorest developing countries like Afghanistan, Pakistan, Bolivia, sub-Saharan countries such as Niger, Uganda and middle east countries like Yemen, Palestinian Territories are still in stage 2.
Stage Three: Post-Industrial Revolution (late expanding) –increase slows down
Example: Most developing countries that have registered significant social and economic advances are in stage 3, such as Costa Rica, Panama, Jamaica, Mexico, Colombia, Ecuador, Philippines, Indonesia, Malaysia, Sri Lanka, Turkey, Azerbaijan, Turkmenistan, Uzbekistan, Egypt, Tunisia, Algeria, Morocco, Lebanon, South Africa, India.
On the way:South Africa, Zimbabwe, Botswana, Swaziland, Lesotho, Namibia, Kenya and Ghana have begun to move into stage 3
Stage Four: Stabilization (low stationary) – very slow increase
Example: Newly industrialized countries such as South Korea and Taiwan have just entered stage 4.United States, Canada, Argentina, Australia, New Zealand, most of Europe, Bahamas, Puerto Rico, Trinidad and Tobago, Brazil, Singapore, Iran, China, Turkey, Thailand and Mauritius
Stage Five: Declining population
Example: Countries like Germany, Italy, Japan, Russia leading to a shrinking population
What happens to birth and death rates?
As populations move through the stages of the model, the gap between birth rate and death rate first widens, then narrows. In stage 1 the two rates are balanced. In stage 2 they diverge, as the death rate falls relative to the birth rate. In stage 3 they converge again, as the birth rate falls relative to the death rate. Finally in stage 4 the death and birth rates are balanced again but at a much lower level.