
Prev
Next
I


CLICK HERE to refer to the diagrams of Linear, Nonlinear and monotonic relationships.
In Statistics, Correlation is largely a measure of an association between variables. In logically correlated data, the change in the magnitude of 1 variable is related to a corresponding change in the magnitude of another variable, either in the same (positive correlation: High-High, Low-Low) or in the opposite (negative correlation: Low-High or High-Low) direction. Very often, the term correlation is used in the context of a linear relationship between 2 continuous variables and expressed as Pearson product-moment correlation. For monotonically (nonlinear) distributed continuous ordinal data(indicate the order or rank of things) or for data with relevant outliers, Spearman rank correlation can be used as a measure. Spearman rho refers to the ranked values rather than the original measurements.
Determine how these two variables are correlated using Spearman’s rank correlation coefficient?
| Variable A (arranged in an ascending order-smallest to largest) | Rank (R1) (assigned after arranging in order) | Variable B | Rank (R2) | Difference in rank (R1-R2)=d | d² |
|---|---|---|---|---|---|
| 200 | 10 | 6.2 | 1 | +9 | 81 |
| 1100 | 9 | 5.1 | 2 | +7 | 49 |
| 1900 | 8 | 3.1 | 4 | +4 | 16 |
| 2400 | 7 | 4.6 | 3 | +4 | 16 |
| 3100 | 6 | 2.5 | 5 | +1 | 1 |
| 3900 | 5 | 1.5 | 7 | -2 | 4 |
| 4200 | 4 | 1.8 | 6 | -2 | 4 |
| 5300 | 3 | 0.4 | 10 | -7 | 49 |
| 5900 | 2 | 1.3 | 8 | -6 | 36 |
| 6500 | 1 | 0.5 | 9 | -8 | 64 |
| Total d² = 320 |
Spearman rank 
where n = number of paired observations


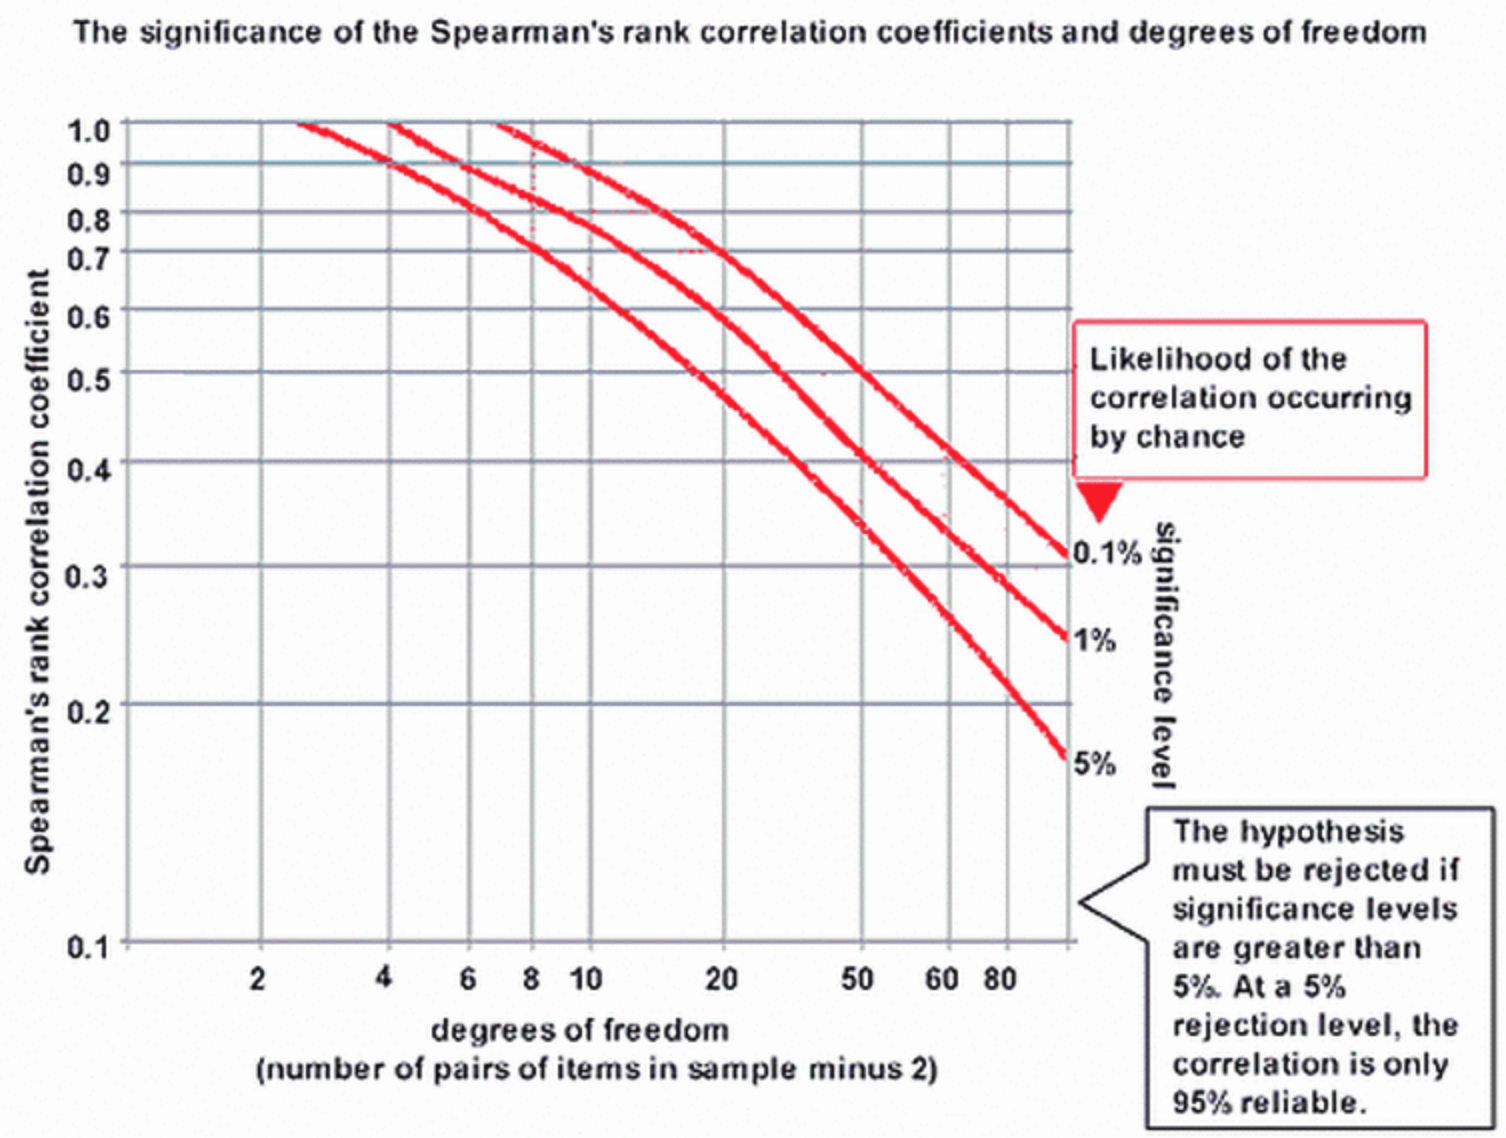
There are (n) degrees freedom (10)


| Number of pairs of measurement (n) | p = 0.05 (95%) (+ or -) | p = 0.01 (99%) (+ or -) |
|---|---|---|
| 5 | 1 | |
| 6 | 0.886 | 1.000 |
| 7 | 0.786 | 0.929 |
| 8 | 0.738 | 0.881 |
| 9 | 0.683 | 0.833 |
| 10 | 0.648 | 0.818 |
| 11 | 0.623 | 0.794 |
| 12 | 0.591 | 0.780 |
| 13 | 0.566 | 0.745 |
| 14 | 0.545 | 0.716 |
| 15 | 0.525 | 0.689 |
| 16 | 0.507 | 0.666 |
| 17 | 0.490 | 0.645 |
| 18 | 0.476 | 0.625 |
| 19 | 0.462 | 0.608 |
| 20 | 0.450 | 0.591 |
| 25 | 0.400 | 0.526 |
| 30 | 0.364 | 0.478 |
| 35 | 0.336 | 0.442 |
| 40 | 0.314 | 0.413 |

What you include depends on the citation style. Chicago A, OSCOLA, Turabian require the use of footnote citations instead of author-date in-text citations. How to insert footnotes using MS Word?


Try out your own Choropleth mapping
Download license free photos
Access maps of the world for your presentations