
| Terminologies | Definitions | Additional notes (for self research) | Diagrams, university courses and classwork |
|---|---|---|---|
| Demography | is the study of population | Click here to view LIVE demographic parameters on Worldometer Basic demographic information of Germany on Worldometers | Click here to have information on the Harvard Center for Population and Development studies |
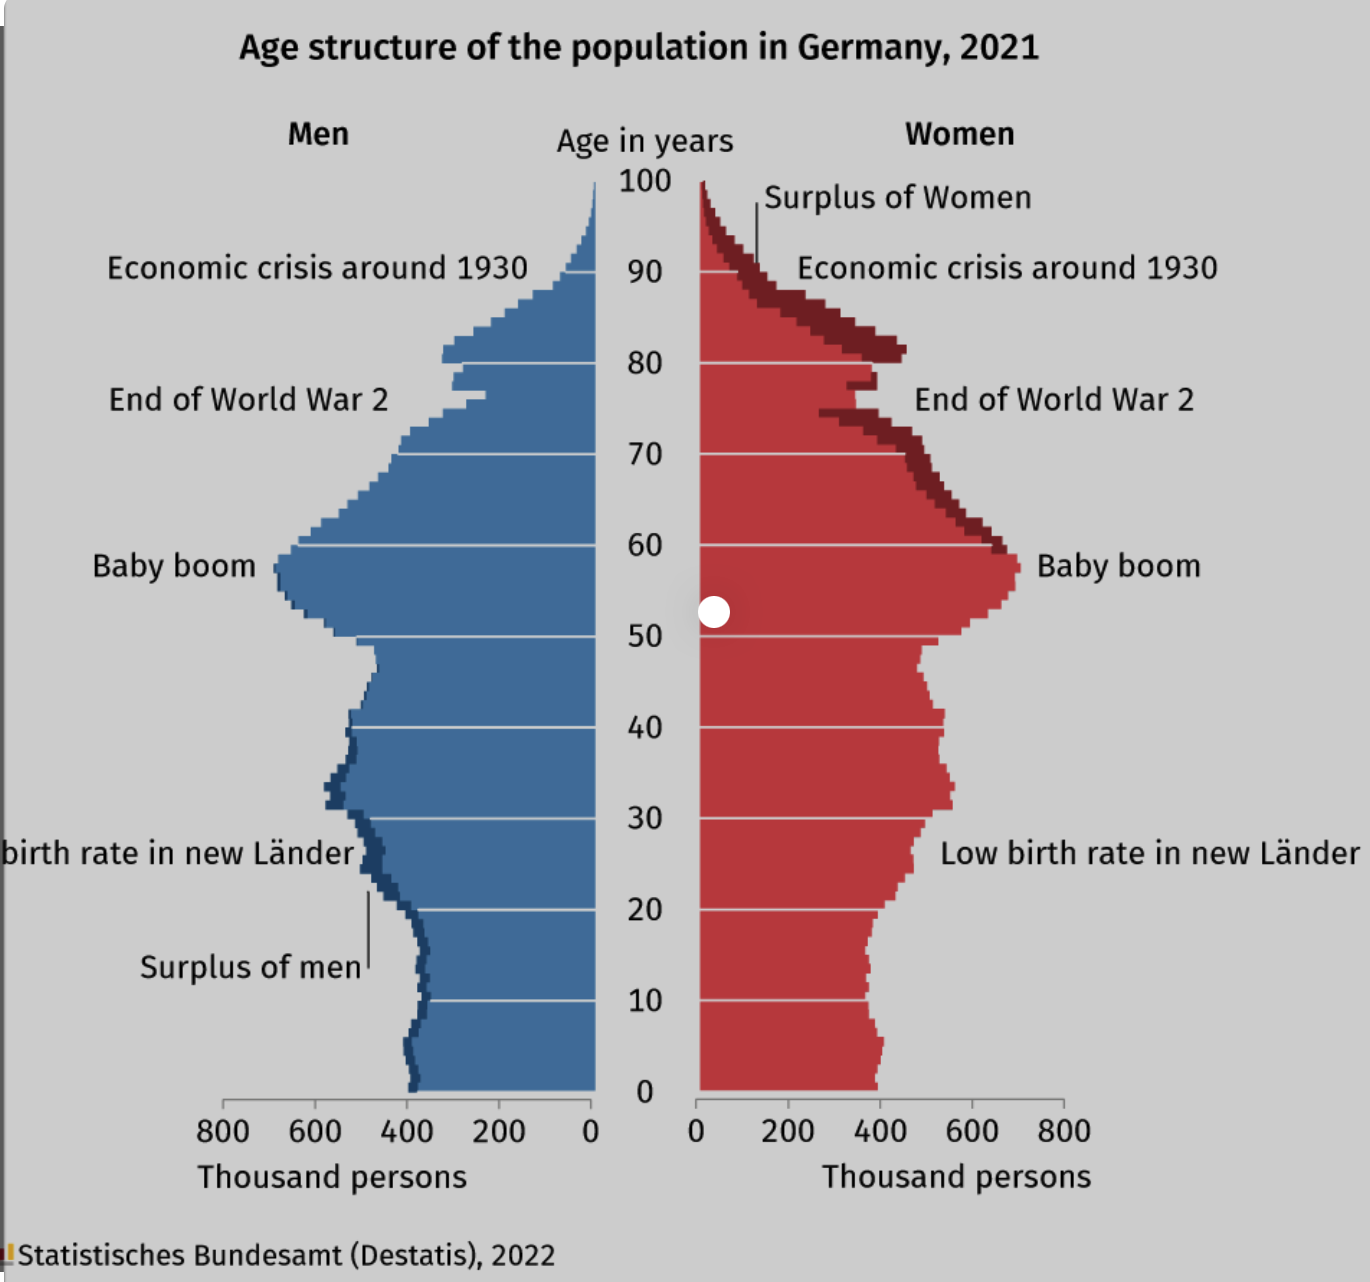
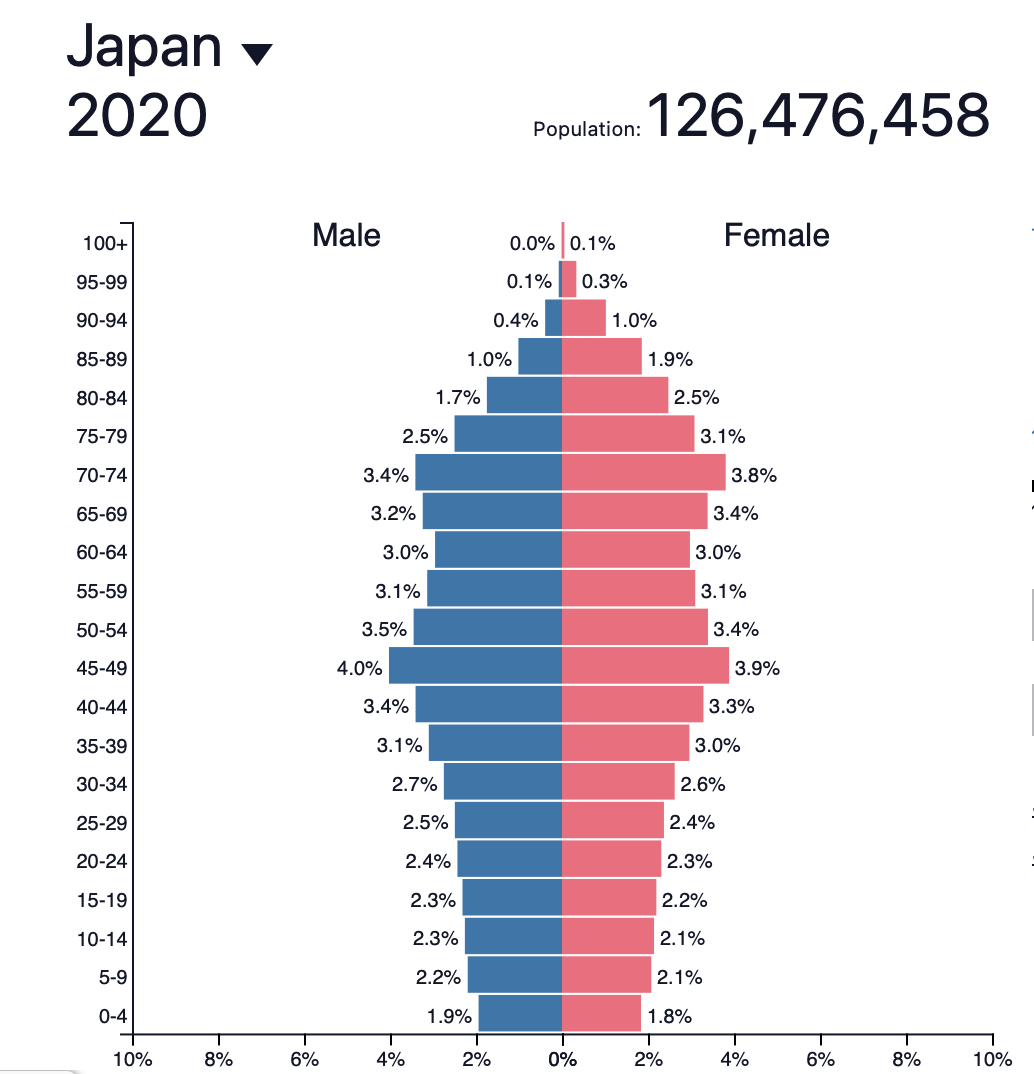
| Population Structure | The way the population is divided up into or made up of proportion/percentages of different age groups and gender. Population structure depicts distribution of several demographic groups such as dependent population, working population, gender ratio and so on. | ||
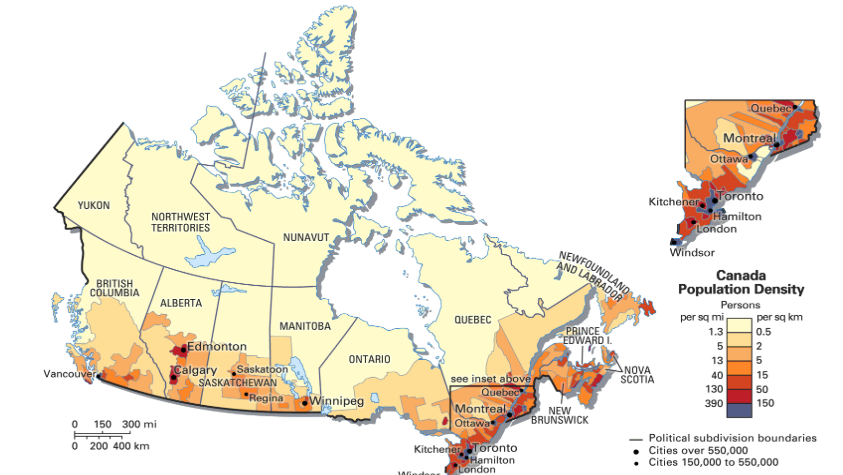
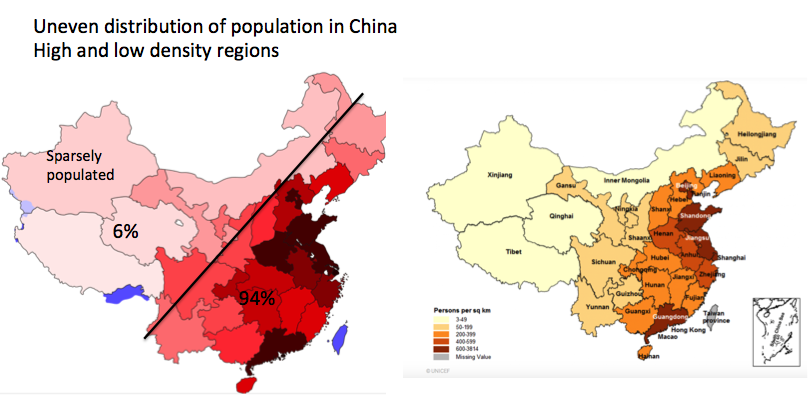
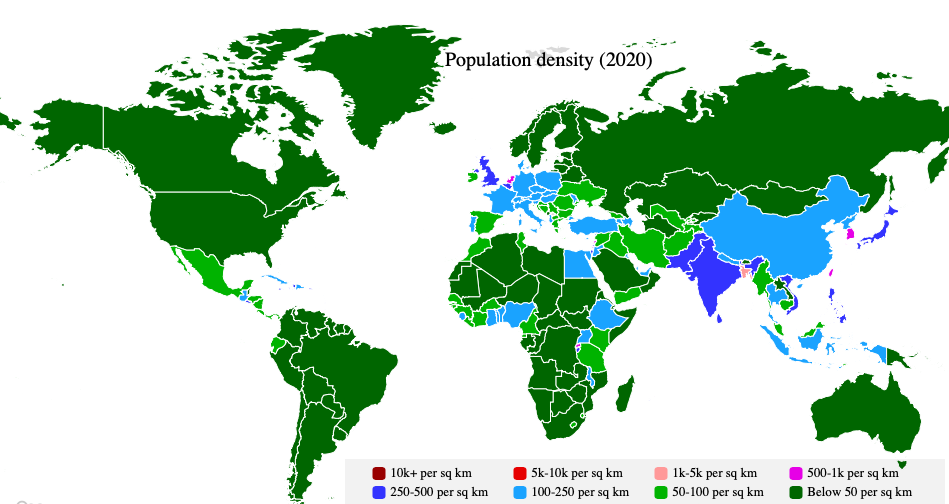
| Population density | population per unit of land area; that is the number of people per square mile or people per square kilometer | Click here to review the ranking of the countries by population density (World Population Review data) Here is the list of the World's most sparsely populated regions | 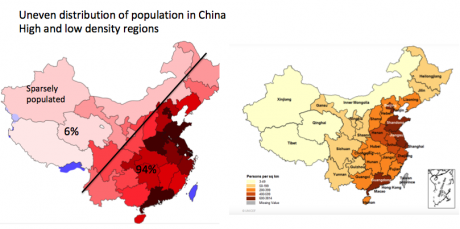 |
| Crude birth rate and Crude death rate (mortality rate) | The number of live births per 1,000 people in a population of a given year. Dearth rate is the number of deaths per 1,000 people in a population of a given year. Morbidity – the frequency of disease, illness, injuries, and disabilities in a population | ||
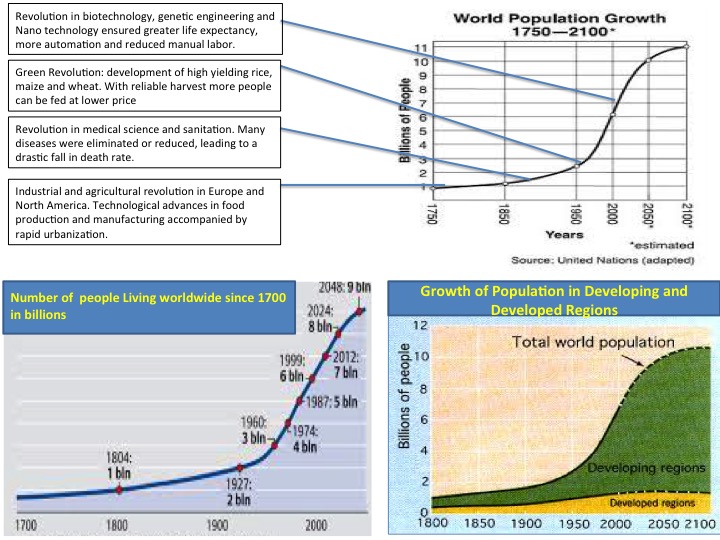
| Natural growth /Rate of natural change and Population growth | The difference between birthrate and death rate. Total population growth rate is the number of people added to (or subtracted from) a population in a year due to natural increase plus the net migration expressed as a percentage of the population. | Click here to review the timeline history of world population growth over time |  |
| Fertility rate | the average number of live births per 1,000 women of child-bearing age (14-49 years) in a given year. Child-bearing years is the reproductive age span of women, assumed for statistical purposes to be 15-49 years of age. Fecundity: is the physiological capacity of a woman to produce a child. | See the Data on World's Fertility Rate | |
| Sex ratio or gender ratio | The number of males per 100 females in a population. | Where Women far outnumbered Men Where Men far outnumbered Women | 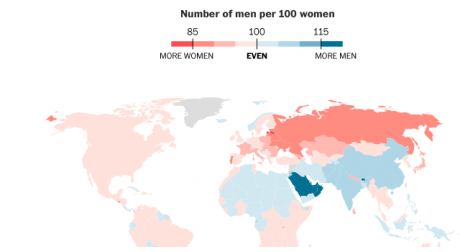 |
| Infant Mortality Rate and Child mortality rate | The number of deaths of infants under age 1 per 1,000 live births in a given year. Child mortality rate is the number of deaths of children under 5 years of age per 1000 children in a given year | Click here to see the Data on Infant Mortality Rate (Country Ranking) | |
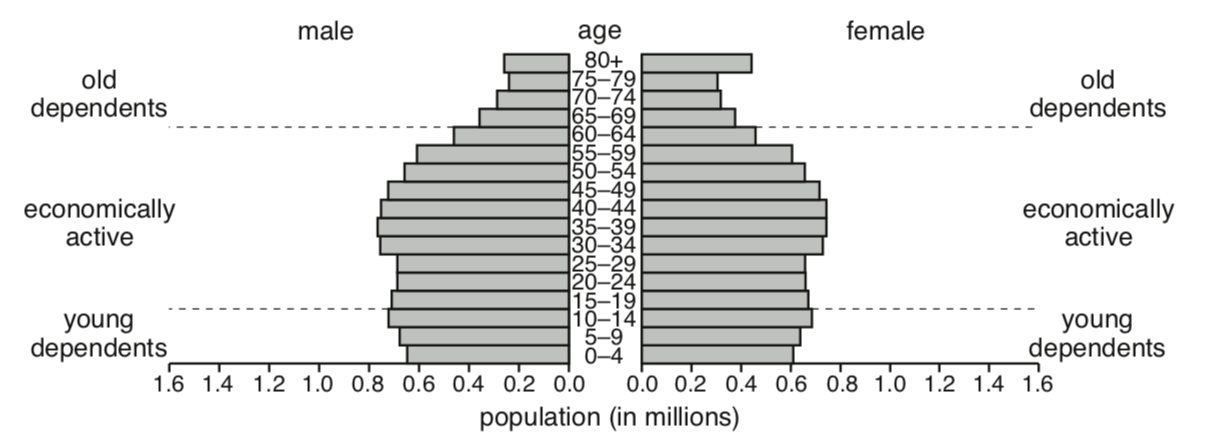
| Dependency Ratio | The ratio of the economically dependent population to the productive or economically active population expressed as the ratio of the elderly people (ages 65 and older) plus the young people (under age 15) to the population in the working ages (between 15-64 years). Older dependency ratio (ODR) – the number of people aged 65 and above for every 100 people aged 20-64 ( peak working population). | Review where are the countries with the youngest population are located? Did you identify any? | 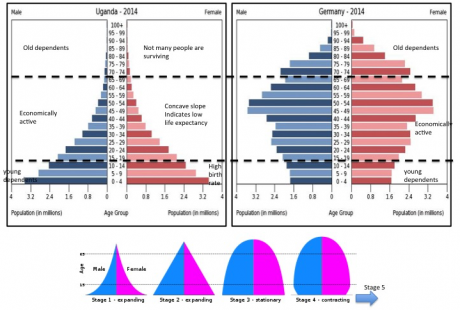 |
| Life expectancy | The average number of years a person can be expected to live from birth if other demographic factors remain unchanged. | According to UN estimate, global average life expectancy of 72.6 years for 2019. | Click here to find out the list of countries ranked by life expectancy. Note down 5 countries with life expectancy more than the global average and 5 countries far less than the global average. Find out the reasons for this variation. |
| Demographic Transition | Signifies the historical shift of birth and death rates from high to low levels in a population. The Demographic Transition Model was developed by the American demographer Warren Thompson in 1929. DTM depicts the demographic history of a country. It refers to the transition from high birth and death rates to low birth and death rates as a country develops from a pre-industrial to an industrialized system. | ||
| Urbanization | Is the growth in the proportion of a population living in cities and towns. It signifies the population shift from rural to urban areas. | More than half of the world's population live in the urban areas. This means around 55% of the population live only over 1% of the global land. High concentration of people over a smaller space is the challenge of urbanization. | Click here to read more facts about urbanization. Shade the areas with very high and very low level of urbanization on the given map. |
| Pronatalist Policy | The policy of a government, society, or social group to increase population growth by attempting to raise the number of births. It aims to encourage more births through the use of incentives | ||
| Antinatalist Policy | The policy of a government, society, or social group to slow population growth by attempting to limit the number of births. This kind of population policy aims to discourage births through education on family planning and increased access to contraception, or by the enforcement of the stricter law such as 'One family one child policy of China' from 1977 to 2015. | Analyze the population policy of Singapore in different periods of time. | |


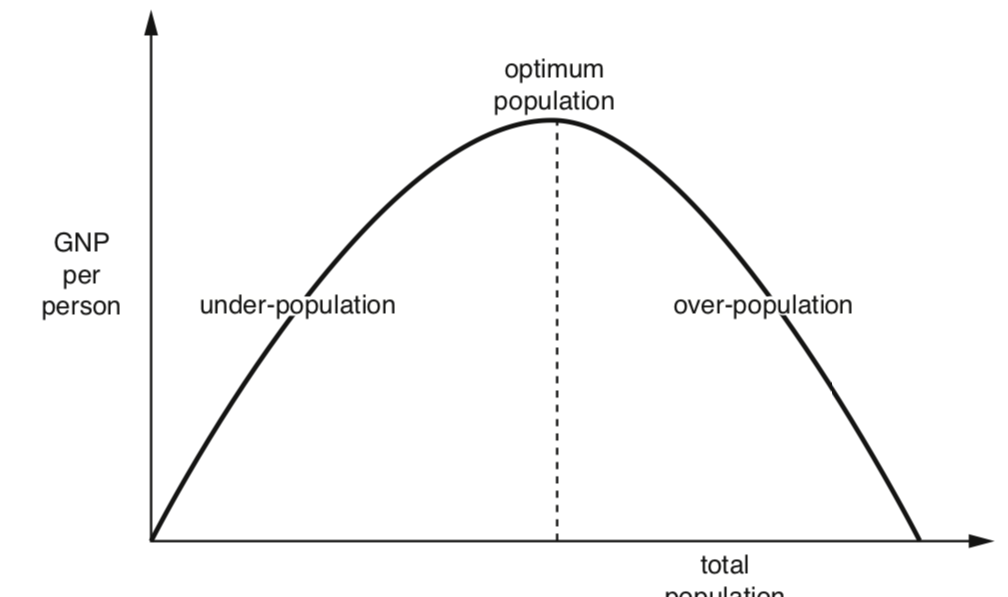
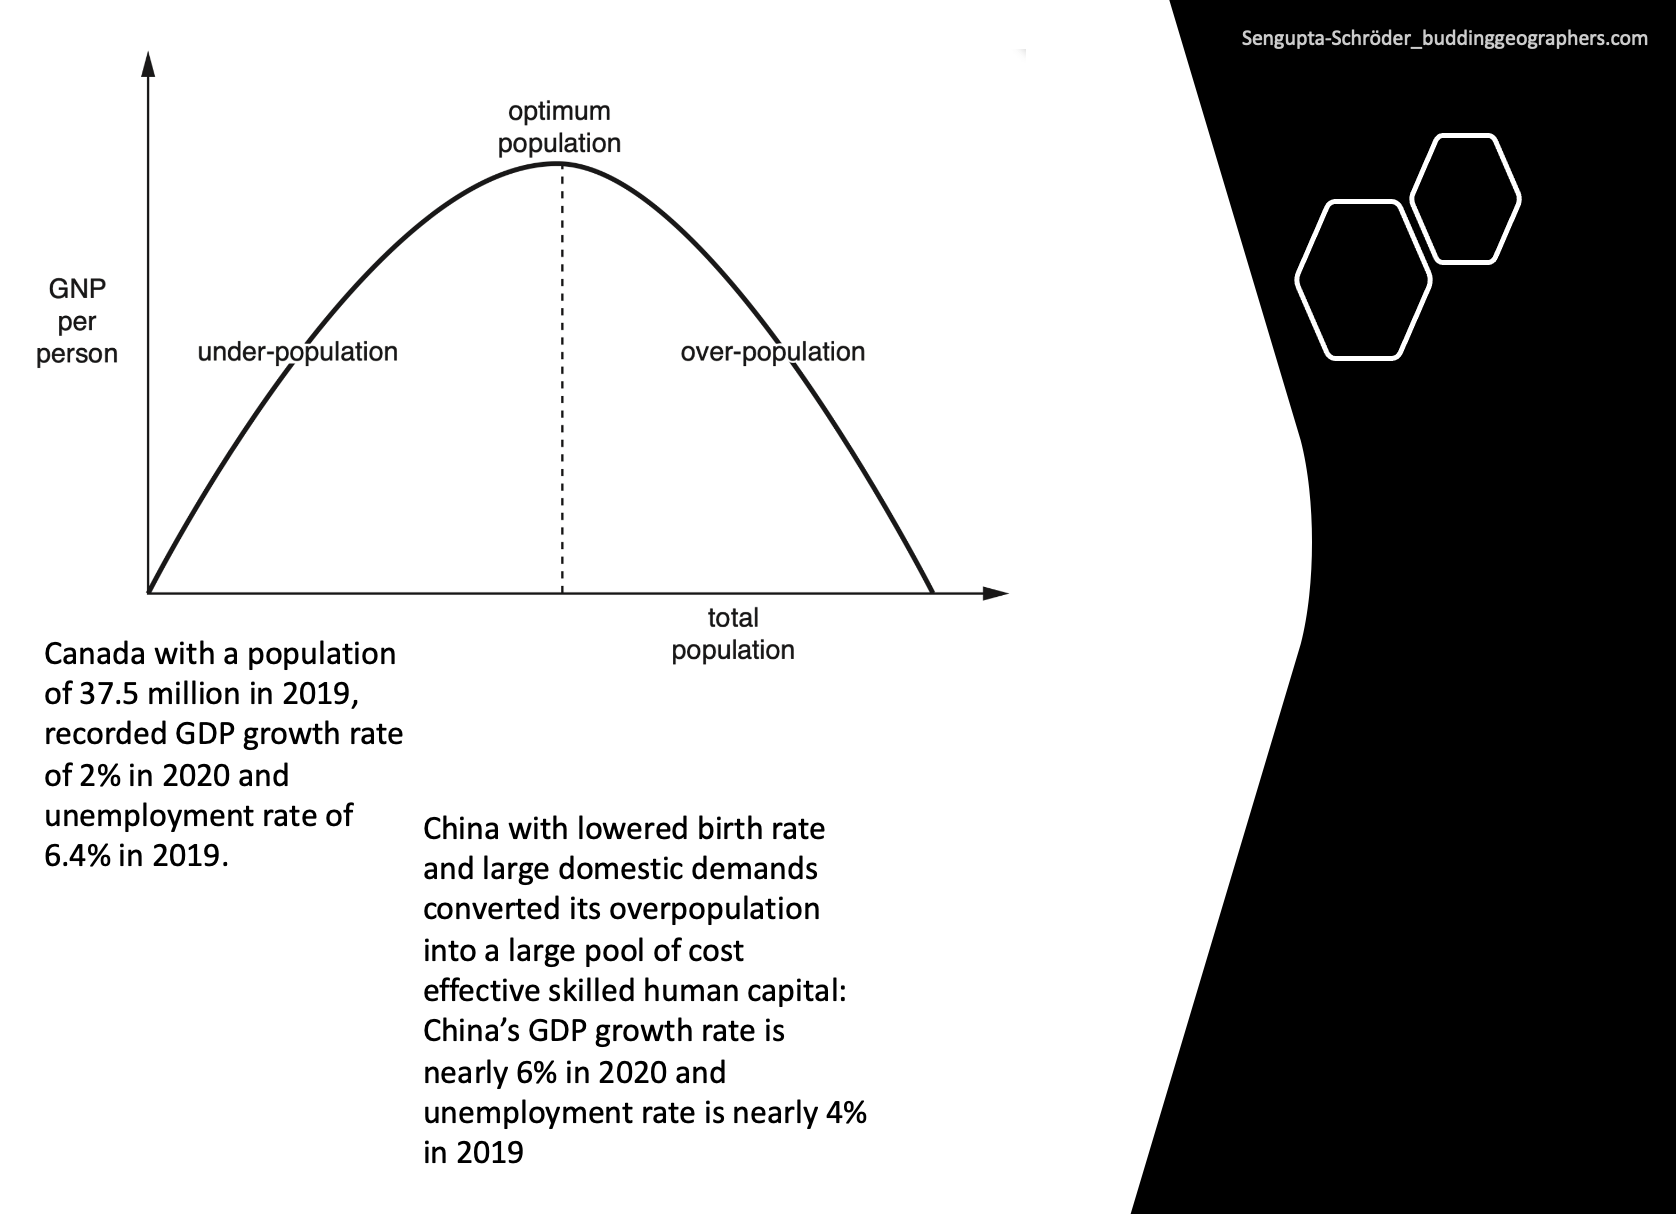
Over, Optimum and Under population
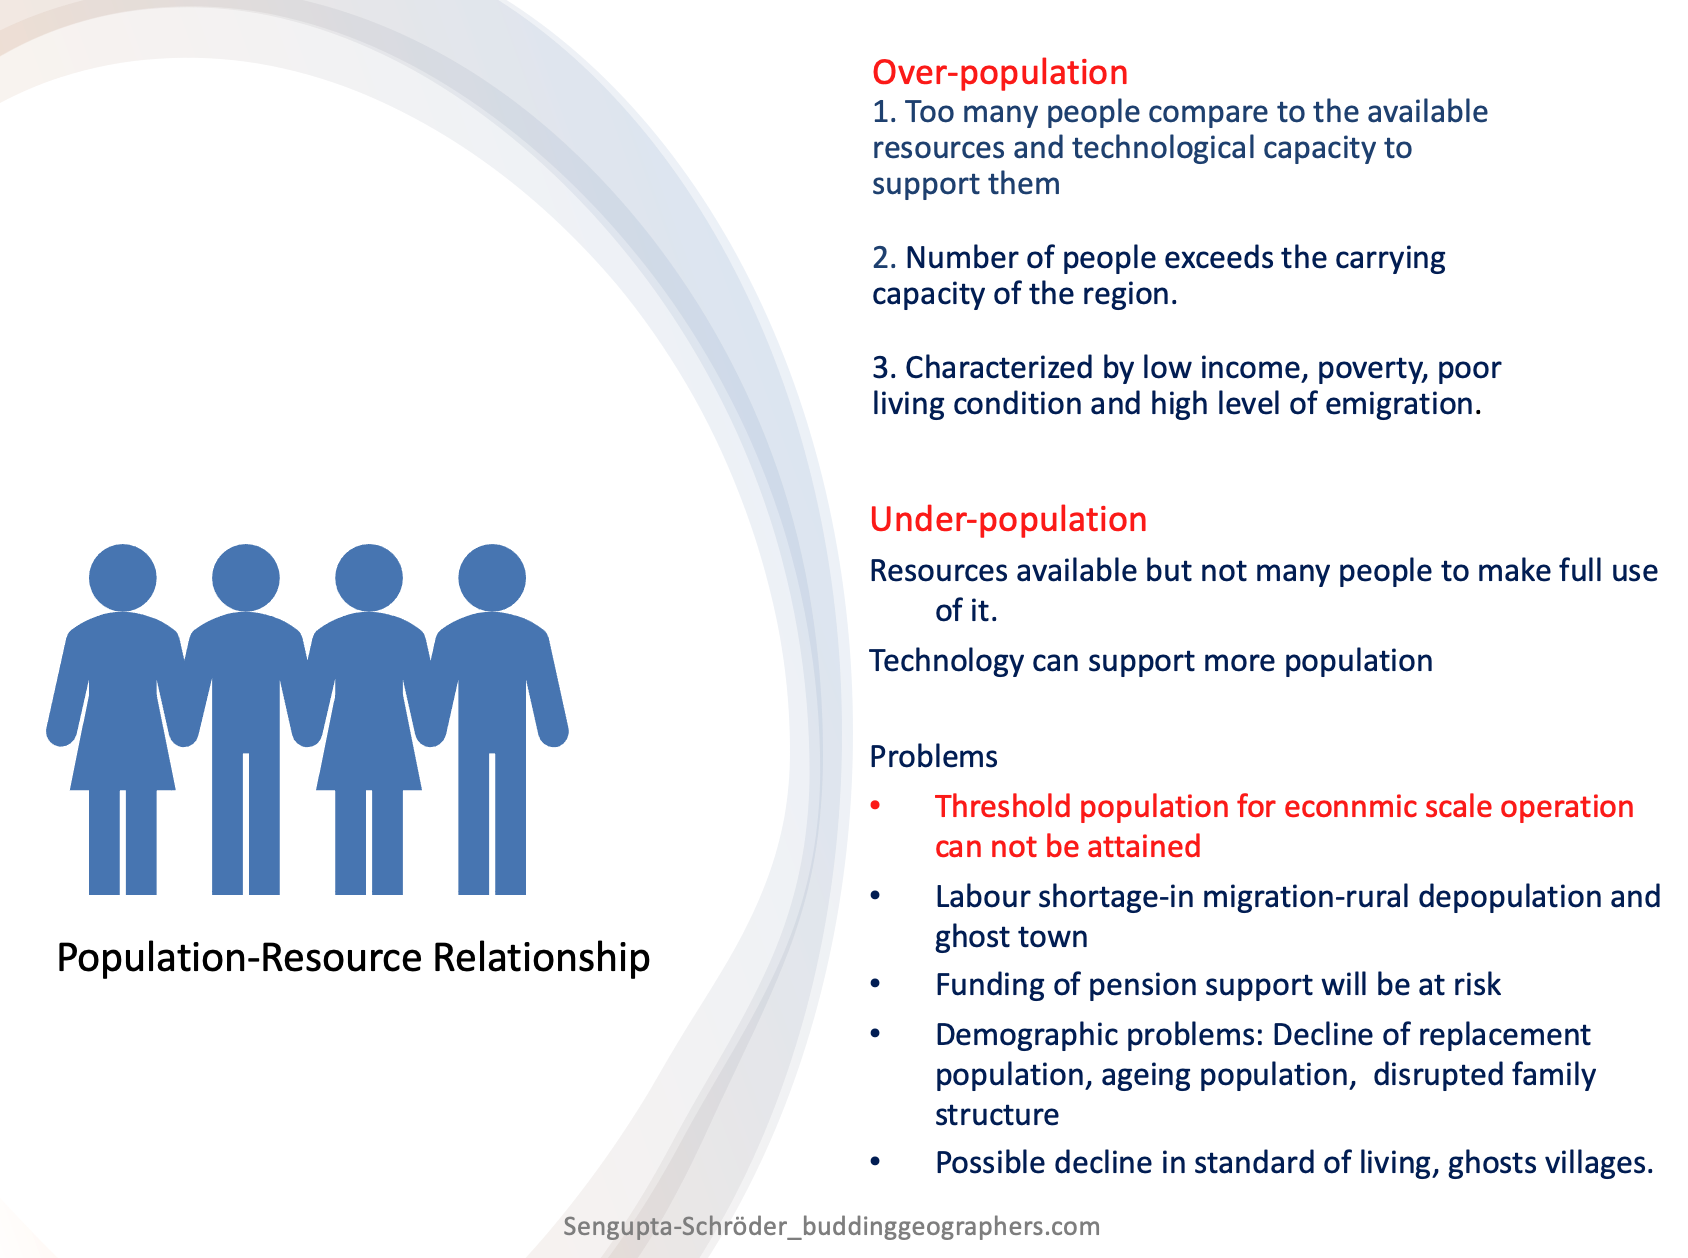
Human overpopulation occurs if the number of people exceeds the carrying capacity of the region means there are too many people relative to resource and technology creating pressure on the available resource endowment and thereby deteriorating the standard of living of a region.
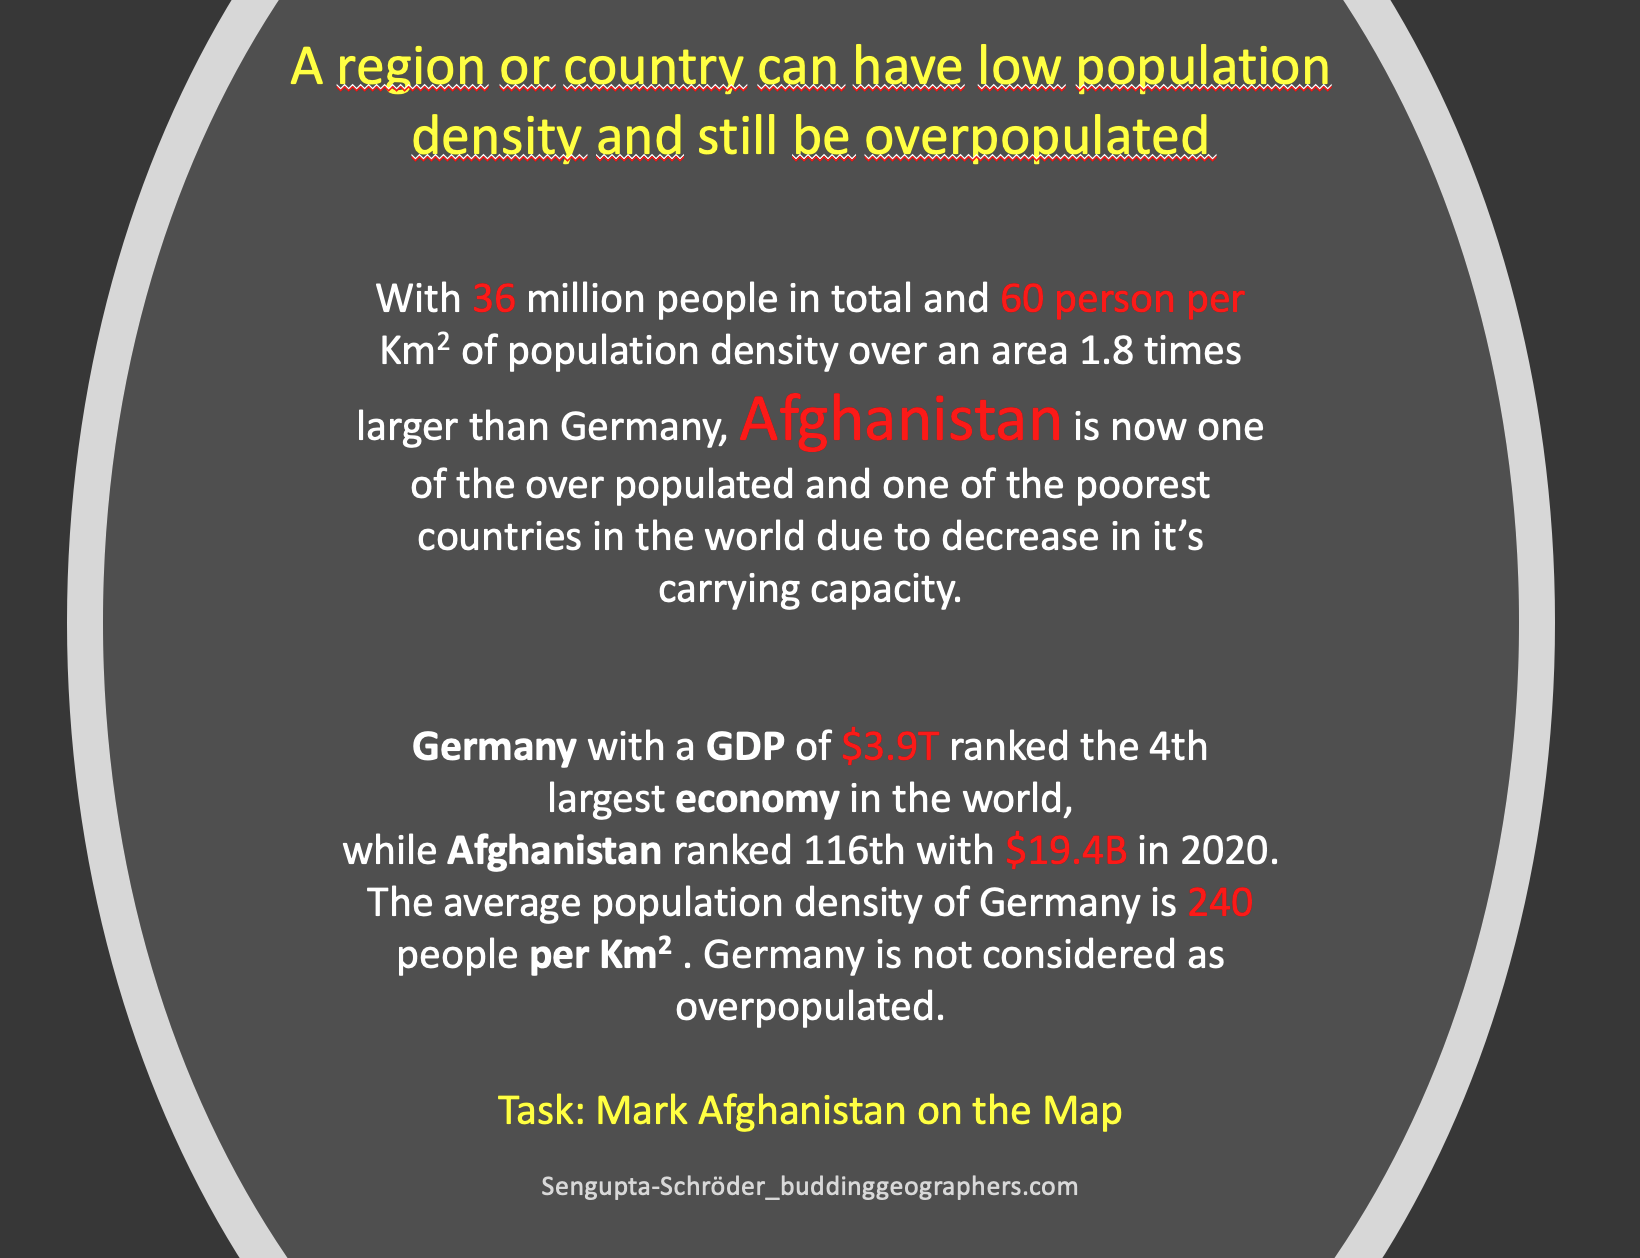
A region or country can have low population density and still be overpopulated e.g. North eastern Brazil (23 people per sq.km) is overpopulated in respect to the carrying capacity of the region and characterized by low income, poverty, poor living condition and high level of emigration. A country may have high population density and is still able to provide for itself because of high technological and economic advancement, will not be considered as overpopulated e.g. Netherlands with 488 inhabitants per sq. km in 2020 is one of the densely populated countries in Western Europe but is not considered as overpopulated.
Many areas of the world are now overpopulated. The problems faced by people in the overpopulated countries are –
- 1. Lack of raw materials, fuel, inadequate food supply and consequent starvation and conflict,.
- 2. Lack of jobs and poverty
- 3. Poor access to education and health care.
- 4. Overcrowded housing, lack of space and squatter settlements.
- 5. Traffic congestion, pollution and high level of disease
- 6. Overused agricultural land, overgrazing, soil erosion and deforestation.
- 7. Inadequate water supply and lack of sanitation.
What is the earth’s carrying capacity for the human population?
This question cannot be answered without considering consumption levels, and the technologies used to generate and support the consumption. The Ecological Footprint data suggest that 3 to 4 planets with the current earth’s bioproductive capacity would be required to support the current population if the whole world start consuming at the consumption level of US.
Class Work
Practice IGCSE exam type questions on over and underpopulation
| Reasons for high birth rate in LEDCs | Reasons for low birth rate in many MEDCs | Reasons for high death rate | Reasons for low death rate | Factors affecting the flow of migration | |
|---|---|---|---|---|---|
| To counter high infant mortality rate. For example: Afghanistan registers 117 deaths of infants per 1000 live births, Mali (104 infant’s death per 1000), Somalia, Chad, Niger, Nigeria records high infant mortality and all these countries are also marked by high birth rate. | Better nutrition and advanced medical care ensure low infant mortality | Poverty, poor nutrition, lack of clean water and sanitation associated with low level of economic development Such as in Lesotho (14.9 deaths per 1000), Somalia, and Mali. | Good living condition and personal hygiene, supply of safe drinking water, access to advanced medical care | Push Factors: Unemployment Lack of safety and fear of persecution Lack of basic services like health and education. Poverty and low standard of living Drought and crop failure Civil war and unrest Risk of hazard Isolation and discrimination Pull Factors: Better employment opportunity Politically stable and safe atmosphere Better service provision Economic opportunities and better standard of living Good food supplies and better nutrition Lower risk of natural hazard Friends and family | |
| Primary sector based rural economy where children are considered as economic asset and are likely to work on farms | Urban life style, lack of time, career pursuit and high cost of living restraint people to have more babies | Ageing population: countries with high percentage of elderly population seems to have high death rate such as in Germany (11 deaths per 1000), Belgium, Austria etc. | Large youthful population as in most of the Middle East countries like Qatar, UAE, Bahrain. | ||
| Children are considered as social security and are likely to look after their parents | Parents do not require children to look after them. Old age security is assured by medical insurance and other old age support system for example Robots to performs domestic work in Japan | Heart disease and strokes and cancer are the major causes of deaths in MEDcs. For example in USA. While Respiratory disease like pneumonia, tuberculosis and parasitic disease like malaria take great death toll in LEDCs. In Russia (13.8 per 1000) one of the major causes of death is alcohol consumption | Increased food supply, better nutrition and healthy diet. | Examples: Internally Displaced People (IDPs)– Syria, Colombia, Pakistan, Yemen and Ukraine, have registered high number of IDPs due to civil war and political unrest. | Examples Better job opportunity-more than 80% of the migrants in UK during the last decade were male and between 15-44 years of age. |
| Lack of family planning knowledge and poor medical facilities such as little availability and awareness of contraception, no access to abortion. | Female emancipation, late marriage and career pursuit prevent them to have more children | Civil wars and conflicts as in Ethiopia, Syria, Ukraine. | Decline in infant and child mortality. Globally infant mortality has decreased from 63 deaths per 1000 live births to 34 deaths per 1000 births in 2013 | Illegal immigrants to USA: There were about 11 million unauthorized immigrants in US in 2020. Mexican make up about half of the unauthorized immigrants in USA mainly in California, Texas, Florida (5% of U.S. labour force) | Immigrants constitute very high % of the population in Qatar (72%), Monaco (64%), Brunai (49%) Singapore (42%), Australia (27%) and Canada (21%). The reason behind this is mainly economic. |
| Ineffective government policy | Low response to pro natal birth policies | Transport related accidents and natural disaster are common cause of deaths in many African countries | Romania has by far the largest number of emigrants per million populations to OECD countries. | China was the top country for immigration into OECD countries followed by Poland. | |
| Cultural and religious tradition that oppose family planning and contraception | Better knowledge of and access to contraception and other family planning measures | Prevalence of HIV. For example HIV related death was highest in Nigeria, South Africa and in India during the last five years | |||
| Traditional gender role and tradition of women to stay at home and to bear child | Socio-cultural maladies like high suicide rate as in Japan. Suicide rate in Japan, South Korea, Nepal and India is 50% higher than the world average Suicide rate can also increase due to socio-economic stress as in Greece (death rate- 11 deaths per 1000 in 2014). Study reveals that austerity in Greece has led to tragic 35% increase in suicide in recent years | Most favored destination of immigration: with 45 million migrants in 2014, USA is the most favored destination of immigration followed by Germany (nearly 10 million immigrant), Saudi Arabia, UK (7 million), France, Canada, and Australia (6 million). | |||
| Early marriages in some society | High infant and child mortality in some countries like Afganisthan (117 deaths der 1000 live births) |
Data source: CIA World Fact Book, EST, World Bank Data and WHO.
Dependent and Working population
Dependency Ratio indicates the relationship between of the economically dependent population to the productive or economically active population. It is expressed as the ratio of the elderly people (aged 65 and older) plus the youthful population (under age 15) to the population in the working ages (16-64). Aging population are usually a product of longer life expectancy and lower birth rate.
Older dependency ratio (ODR) – the number of people aged 65 and above for every 100 people aged 16-64 (working population).
Dependency ratio =
Youthful Population ( 0-16 age group) + Elderly population (population over 64)
Working population (16-64 age group)
The higher the dependency ratio, the greater the economic pressure on the working population to pay more taxes.
Juvenility index =
Population between 0-16 age group
Population above 16 years
The higher the juvenility index, the greater the proportion of youthful population in a country.
Older dependency ratio (ODR) =
Non-economically active population (over 65)
Working population (16 -64 age group)
Life expectancy at birth
Life expectancy at birth denotes the average number of years a person is expected to live at birth if the current mortality conditions remain unchanged throughout the rest of the life. Life expectancy at birth is the commonly used indicator for analyzing mortality.
Factors affecting Life Expectancy
- 1.Size of the elderly population reaching the end of their life cycle.
- 2. Advances in healthcare and medicine including reduced infant mortality.
- 3. Economic development and improved quality of life, better sanitation, access to clean and safe drinking water.
- 4. Environmental conditions like less pollution, more greenery reducing the risk of cancer and respiratory diseases.
- 5. Healthy and sustainable lifestyle reducing the risk of coronary diseases.
- 6. General level of education that unplugs wide choices and awareness
- 7. Frequency of catastrophic natural hazards and community preparedness to deal with. For example more than 90% of the population of Bangladesh, Nepal, Burundi, Haiti, Taiwan, live in areas at high relative risk of death from two or more hazards.
Consequences of Youthful and Ageing Population: Problems and Possibilities
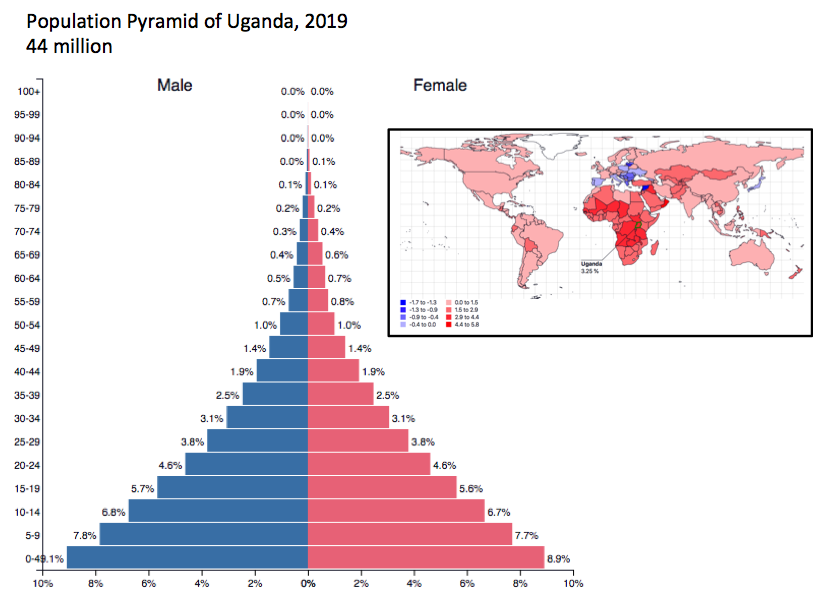
| Youthful Population Countries with high % of youthful population: Countries of sub-Saharan Africa and the Middle East. More than 45% of the population is youthful in Niger, Uganda, Mali, Zambia, Burundi, South Sudan. All these countries register very low median age of population ranging between 15-17 years of age. In absolute numbers, India has the world’s largest youth population. |
|
|---|---|
| Problems (negative aspects / disadvantages) | Possibilities (positive aspects / advantages) |
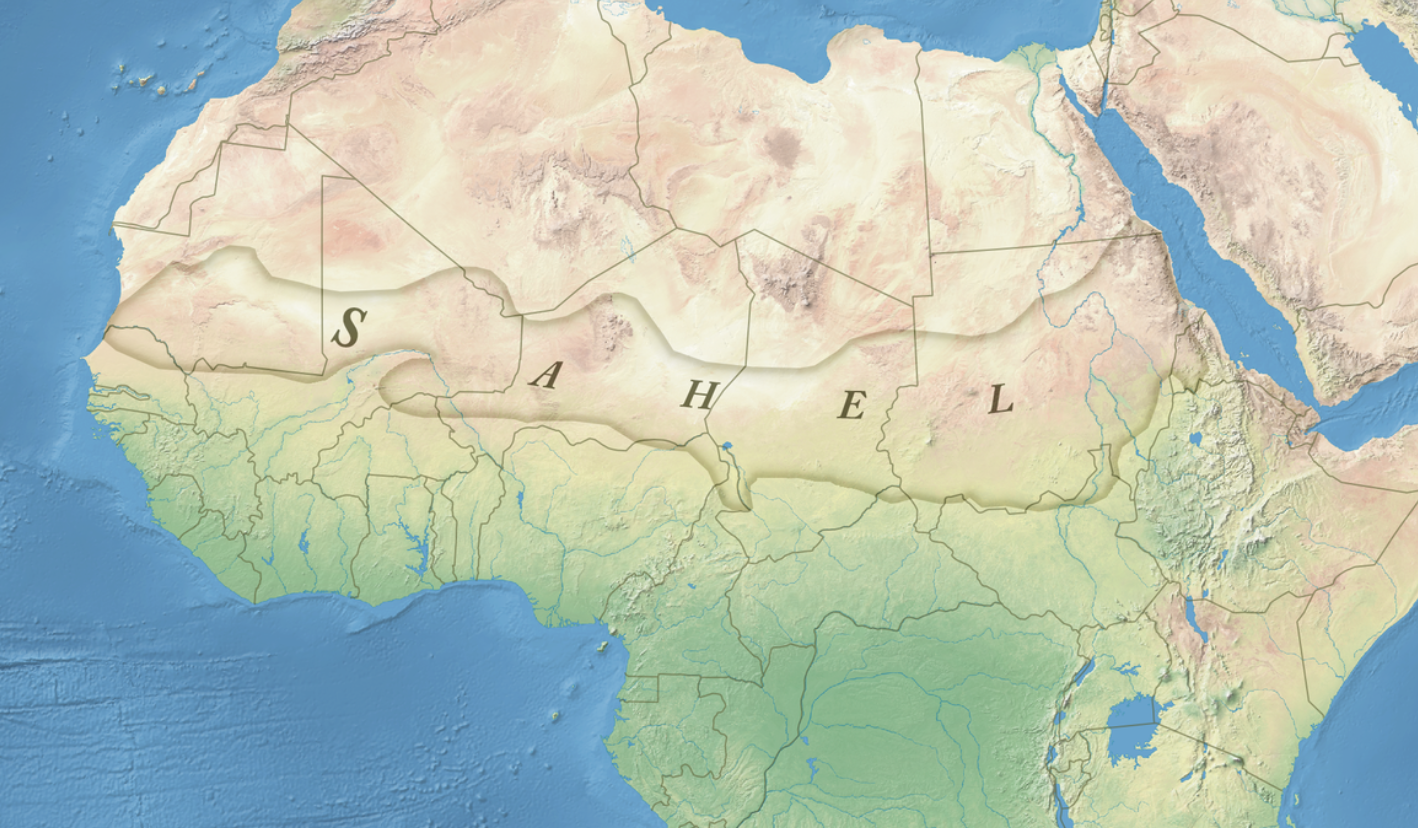
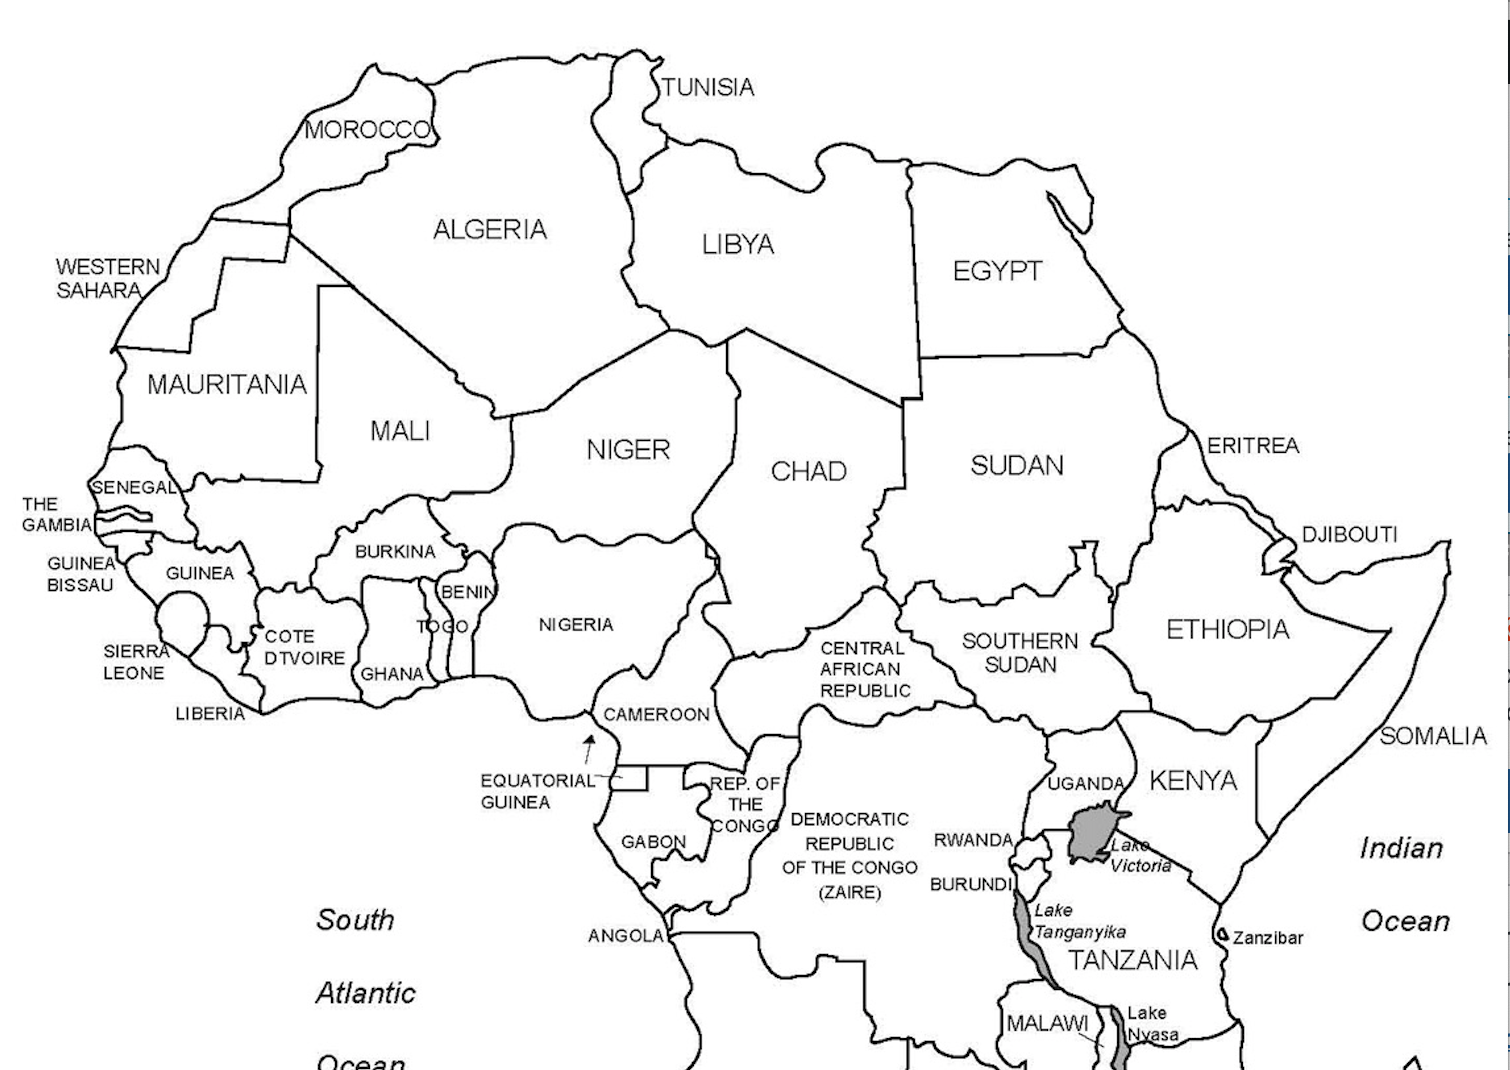
| Large youthful population will demand more food. Strain on food supply can cause overgrazing and over cultivation, which in turn may lead to desertification. Many sub-Saharan African countries such as Mali, Nigeria and especially the semi-arid transition region of Sahel witnessed devastation as a result of human misuse of the land. Hundreds of thousands died of starvation. The growth rate of population in this region (3% per year) exceeds the growth rate of food production (2% per year). Overgrazing and poor agricultural practices lead to soil erosion and further degradation of the land. | Large youthful population provides the country with a chance to build an educated and skilled manpower for the future. This large cheap future workforce may act as an engine of growth for the entire economy. |
| It creates pressure on the existing resources and strains the education, health services, food supplies and accommodation availabilities. Government has to build special types of infrastructures to cater to the need of the youthful population such as availability of enough immunizations,providing schools and teachers, sports facilities and good public transport system. | Provides a growing market for the manufactured and consumer products. A country with a large youthful population may become a destination for foreign direct investment (FDI) apprehending a large consumer base in future as the young population enters into the working age. Young people are also the target group of the large MNCs selling consumer durables like play stations and mobile phones or global food chain like MacDonald, Starbucks. Consumer culture spreads faster in youthful generation. |
| Rural areas may become unable to sustain the growing young population and this would possibly cause rural to urban migration. Overcrowding in towns and cities could lead to shantytowns, poverty and lower standard of living. Need for more physical space would create ecological destruction. | Countries with a large base of youthful population and comparatively well developed health care system like Qatar, Saudi Arabia register lower death rate. |
| Economic pressure on the working population to support the young dependents. It may results into more taxation to raise government revenue to be able to spend for the necessary infrastructure development. On the other hand, schools, collages, sports facilities etc. may also become expensive due to rapid increase in demand. | If the country is able to grow and create jobs for the growing youths, it will provide a large tax base for the country in future. |
| Having a high proportion of youthful population means more competition in the job market and lack of availability of jobs in the future if the economy of the country fails to grow at a suitable pace by creating new opportunities for the young generation. Scarcity of employment opportunities may lead to social unrest as in North African region and in Greece. | Innovation and revolutionary ideas may surge into the society. For example, the rise of Arab Spring (mass popular protest against the dictatorial law and order situation, unemployment, corruption and rising prices in the Arab world) is closely related to the demographic configuration of the Arab world. Nearly 60% of the population across the Arab world is under the age of 30 and are free of the fear that held back their parents. Protesters in Jordon and Morocco wanted transition to constitutional monarchy, People in republican regime like Egypt and Tunisia overthrew the corrupted president and called for free election. |
| Political instability, conflict and even civil war may erupt in the country if the government is unable to maintain and control the growing population such as in Djibouti (54% of the workforce is unemployed), Congo (46%), Angola (26%), Tunisia and Syria (15%). | |
| Youthful population tends to register higher crime rate like vandalism, robbery, graffiti and burglary etc. Researches show that unemployed youths tend to join terrorist groups or in underworld activities as in Afghanistan. | |
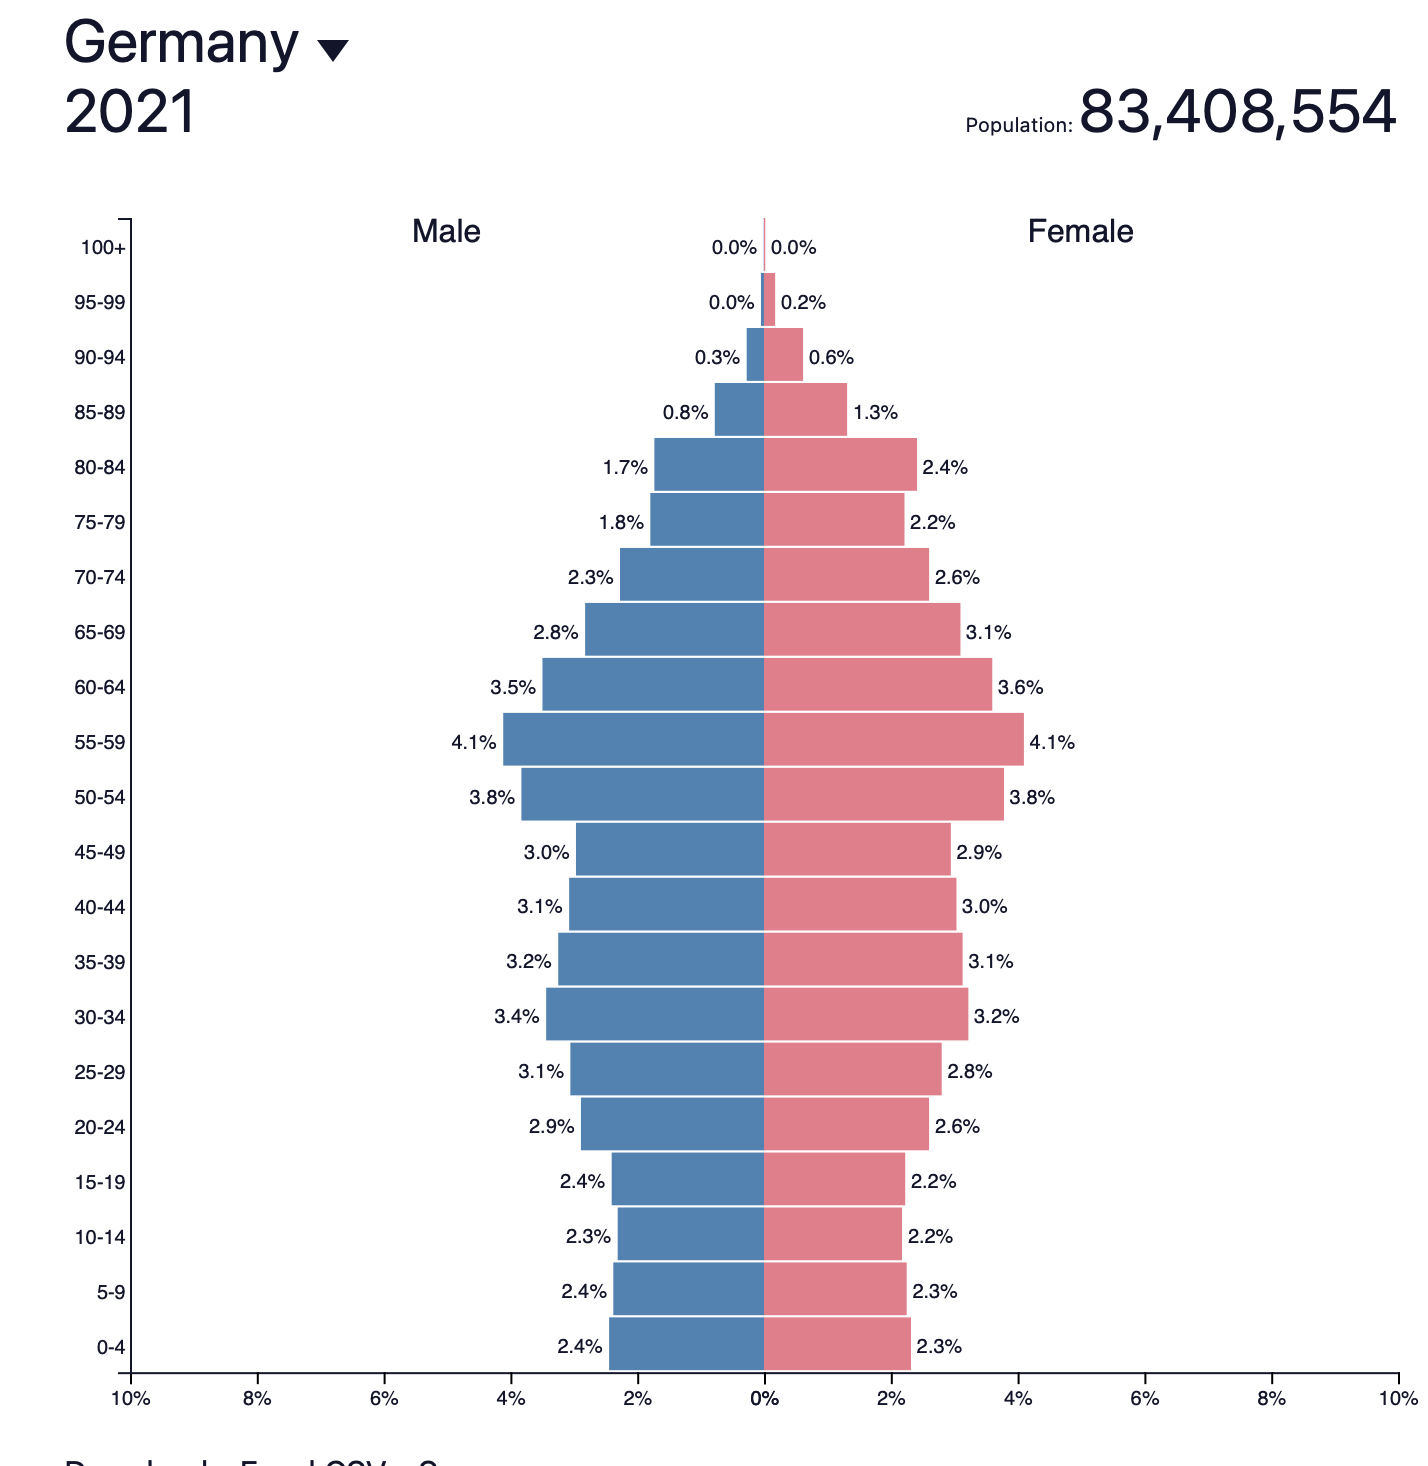
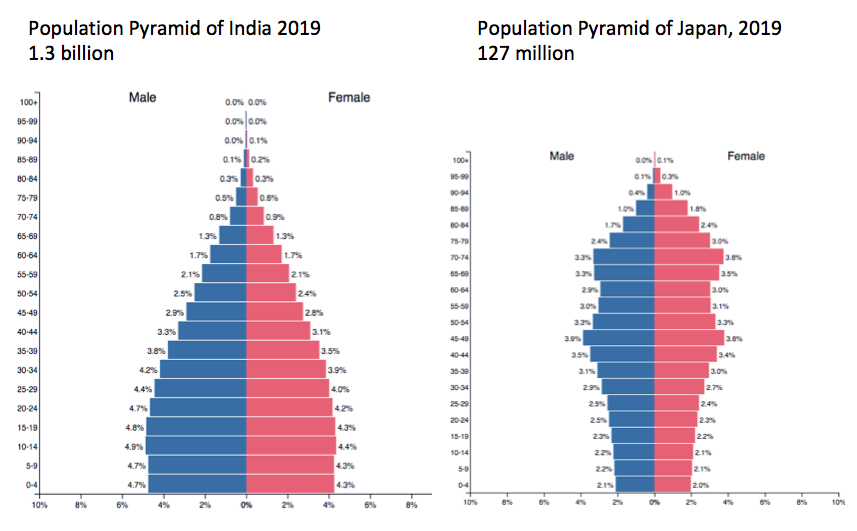
| Ageing Population Countries with high % of elderly population: Japan and west European countries like Monaco, Germany, Italy, Austria with a median age of over 40 years. Elderly population constitute 17% of the total population in Germany. By 2060 nearly 40% of the population in Japan will be over 65 years of age | ||||
|---|---|---|---|---|
| Problems (Negative aspects) | Possibilities (positive aspects) | |||
| Pressure on working population, as they have to pay higher taxes to support the pension budget. Working population and the government have to support and cater to the need of the elderly population. Budget deficit will climb higher and higher as pensioners collect their retirement and medical benefits, all to be paid by a shrinking core of taxpayers. | Elderly people are a crucial part of the community and they contribute both knowledge and experiences useful to train the young generation. In certain skilled based industries like watch making, education, consultancy services elderly people are more valued over younger generation by the employer because of their valuable experiences and acquired skills. | |||
| Increased government spending on health care and pensions. Higher savings for pensions may reduce capital investment. More money needs to be spent on specialized health care, building of hospitals, old care homes and other specialized services for the elderly like wheelchair ramp on the buses and trains etc. This will reduce the scope of productive investment in education, research and in building up of economic infrastructures. This may cause trade deficit in future. | A significant portion of the ageing population in Europe, Australia and Canada are still physically and mentally much healthier than their preceding generation and are willing to work and contribute to tax revenue. In 2007 Germany raised its retirement age from 65 to 67 and the German government is now thinking about increasing the retirement age to 69 for full pension payments to start. | |||
| As older people do not work but demands several services, there will be a crunch of workers. Reduced supply of workers leads to increase in wages. This will delay the retirement age of the people as in Germany and will cause more immigration. With nearly 10 million immigrants in 2014, Germany has become the 2nd most preferred destination for the immigrants after the USA. | In MEDCs with an ageing demographic structure, elderly people are often viewed as an important market for certain types of products, known as ‘grey economy’. This may range from holiday companies, healthcare provider to hair color. Retirement migration to coastal resorts in Europe created a higher demand for specialist housing and services. This has helped to regenerate the remote rural areas from declining. | |||
| There will be less people to defend country and defense system will be more automated, expensive and destructive. | Voluntary services are a measure of social capital and an indication of a healthy society (Bittman 2002). Elderly people aid their families with childcare and find satisfaction in providing charitable services. Therefore, elderly people helps to built-up social capital. | |||
| Lack of innovation | A society with elderly population tends to register lower crime rate. | |||
| Reduced demand for manufactured and consumer goods. Industries migrate overseas for cheaper young labor creating trade deficit. | Art and culture benefits from an educated elderly population. The older generation in MEDCs are actively involved in community clubs and libraries. They also attend classical musical concerts, theater and art galleries more frequently than younger people. | |||
| The elderly may also have some unique and largely forgotten traditional skills to pass on to the younger generation. For example, the granny women in Southern Appalachian in the USA are the healers and midwives for the rural and secluded Appalachian community. | ||||
IGCSE Question Bank: Examples of exam type questions with answer keys
Suggest three ways in which a population pyramid for an LEDC is likely to be different from that of an MEDC.
- LEDC population pyramid will have narrower apex (tapering top) indicating higher death rate particularly in the elderly age group (70+). Therefore it will be more pyramidal shaped than MEDC population pyramid.
- It is less likely to have bulges in the economically active group (16-64 age groups) in LEDC population pyramid as emigration tends to be larger than immigration in LEDC.
- LEDC population pyramid will exhibit concave slope indicating relatively high death rate and low life expectancy.
Explain how death rates have been reduced in NICs (newly industrialized country), such as in Philippines, Malaysia, Brazil, India,Thailand, Turkey. OR suggest reasons for the large increase in the percentage of the population over the age of 65 which is expected in Indonesia and Malaysia by 2025.
- Availability of better treatment of diseases with greater access to necessary medicines and medical research. Greater access to vaccinations, inoculations and immunization has increased survival rate and reduced child mortality.
- Improved health care facilities with modernized hospitals and clinics. People have access to regular check-ups. Many of the NICs like Thailand, Singapore, India have become the new medical hub of the world offering good quality treatment at a much cheaper price than MEDCs. Economic growth and large taxpayer base helped the governments to invest in Old care homes and services for elderly.
- Most of these NICs have qualified man power to ensure sufficient supply of doctors and nurses
- Better water supplies, improved diet and increased efficient food production have ensured healthy and better living standard.
- Better sanitation and hygiene awareness have improved living environment
- Pensions and other economic support from government has helped to reduce stress
- Awareness and greater use of contraception has helped to reduce STDs and HIV
- Better preparedness for natural disasters and efficient disaster response system has helped to reduce catastrophic death.
Explain why, in LEDCs such as Uganda young dependents make up a large percentage of the population/ reasons for high birth rate in LEDCs OR Suggest three reasons why the birth rate is higher in Pakistan (an LEDC) than Australia (an MEDC).
- To counter high infant mortality rate. People tend to have more children in the hope that some will survive. For example in Sierra Leone (107 deaths per 1000 live births), Angola, Mali, Somalia register very high infant mortality rate also record high fertility rate.
- Primary sector based rural economy where children are considered as economic asset and are likely to work on land, perform domestic work like looking after younger children or collect water; fuel wood etc and are likely to send out to earn money for the family.
- Lack of family planning and poor medical facilities such as no access to abortion, little availability and awareness of contraception or other birth control measures.
- Children are considered as social security as they are likely to look after their parents in old age.
- Ineffective government policy
- Cultural and religious tradition like desire for a son to perform certain rituals, certain religion like Islam and Roman Catholic Church oppose contraception.
- Traditional gender role and tradition of women to stay at home and bear children exacerbated by early marriages in some society.