

Data reference and sources: https://www.populationpyramid.net and https://www.indexmundi.com
Click Here to know which countries have the highest birthrates in aging Europe?
Population Pyramid
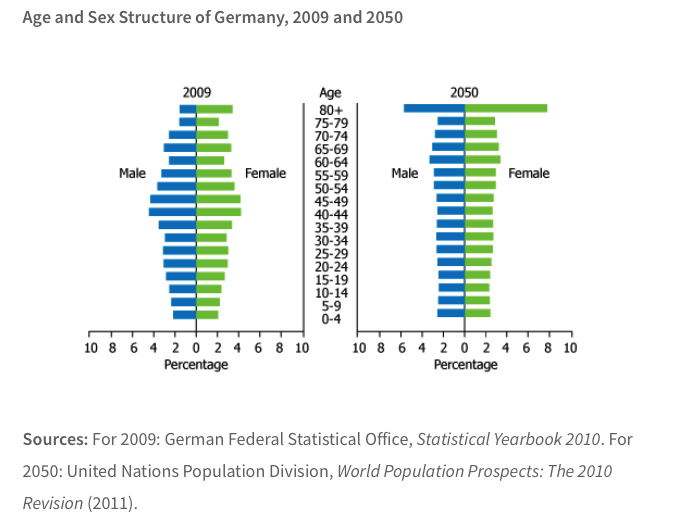
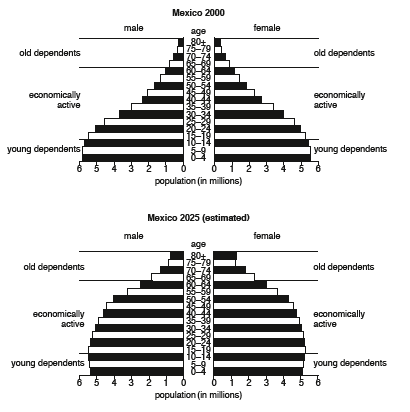
The most studied aspect of population structure are age and birth ratio. Other aspects are language, religion, ethnicity, occupation etc. Age-sex structure is conventionally illustrated by the use of population pyramid. Population pyramids are bar graphs that represent the age-sex composition of a country’s population. Each bar graph represents a five year age group apart from the top most bars which usually illustrate the population of 80 years old and above. The male population is represented to the left of the vertical axis and females to the right.
- Population pyramid can portray absolute or relative data.
- Pyramid with Absolute data- shows the figure in thousands or millions that is in absolute numbers.
- Pyramid with relative data- shows the data in percentage and allows easier comparison.
Utility of a Population Pyramid
- Illustrates the age-sex structure of the population
- It gives information about birth rate, death rate, life expectancy, male-female migration, working and dependent population
- Indicates stage of demographic transition
- demonstrate population growth pattern that helps in population projection
- Help in demographic and economic planning- what kinds of services and facilities will be needed in future.
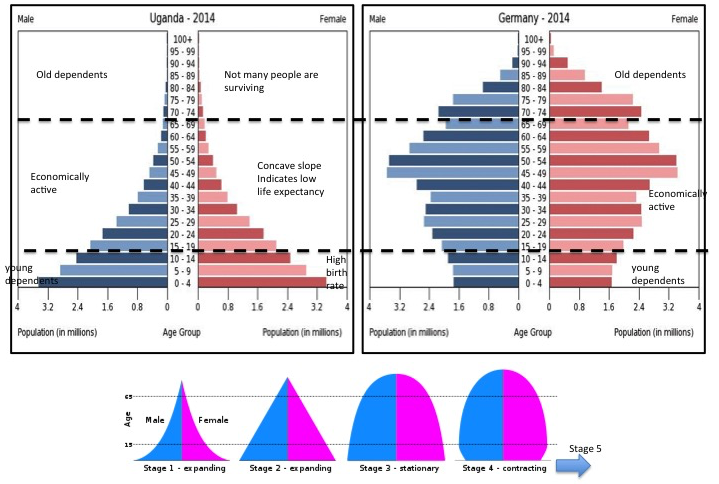
Interpreting a Population Pyramid
- A wide base suggests high birth rate
- Narrow base shows low birth rate as small numbers of children are born. Therefore, narrowing base indicates a falling birth rate.
- A broad top or wide apex indicates high proportion of people living longer.
- Straight or near vertical sides depicts a low death rate. A population pyramid that has fairly straight sides (more like a barrel) shows a population with a falling birth rate and a rising life expectancy.
- Rapidly tapering top or concave slope suggests high death rate and low life expectancy. Over time, as a country develops, the shape changes from triangular to barrel-like. Places with an aging population and a very low birth rate would have a structure that looks like an upside-down pyramid.
- A population pyramid that is very triangular (e.g. Mozambique in 2000) shows a population with a high number of young dependents and a low life expectancy.
- Bulges in the slope indicate high rate of immigration or a preceding baby boom year. This could be because of the economic migrants if the bulges are typically at the working age population group. On the other hand, if the bulges appear at the retirement age group then that can be attributed to the counter migration or returning migrant’s flow or the due to the maturity of the baby boom cohorts.
- Sudden indents at the side of the pyramid indicate higher death rates than normal may be because of a war, famine, disease (epidemic) or natural catastrophe etc.
- Deficits in slopes or distorted pattern in the same cohorts signifies gender specific out migration or sex specific death rate
Click here for the visual display of the changing population structure of the World from 1950 to 2050
Construct population pyramid using Excel
FUN LEARNING TIME
Click here for the Random Wheel Game to Revise the topics you have learned
You need to explain the term and get ready to face questions in group discussion
FUN LEARNING
Demographic Transition Model
was developed by the American demographer Warren Thompson in 1929. DTM depicts the demographic history of a country.It refers to the transition from high birth and death rates to low birth and death rates as the country develops from a pre-industrial to an industrialized economic system.