What is a Map?
Maps are generally symbolic, two-dimensional graphic representation of any elements or whole of the earth’s surface drawn to a scale. Maps are commonly used by the geographers as one of the most important tools to depict and display information about the forms, pattern and changes in the physical and human landscape. Maps are now digital and multilayered. Cartography (the science and art of map-making) has been largely subsumed by the Geographic Information System (GIS) during the last few decades.

Topographic maps:
Topographic maps provide a detailed representation of the natural and man-made features of the earth’s surface. The main characteristic of such maps is the representation of the three-dimensional terrain or relief by the use of contour lines. Symbols and colors are used in topographic maps to identify cultural and natural features. For example, cultural features can be roads, trails, buildings, boundaries, railways, power transmission lines, pipeline, mines, dams, recreation areas. Natural features may include water (rivers, streams, lakes, wetlands), relief (mountains, valleys and other landforms), vegetation (forested areas, built-up areas). Toponomy is added to provide textual information about features.
Why do we need a map scale?
Real world features are very large and cannot be represented in their true scale. In order to represent the real world, maps are made to a specific scale. Map scale is the ratio of the distance between two points on the map to their corresponding distance on the ground.
Different types of scales
According to the size or details of representation
Large scale maps cover a small area with great detail and accuracy while small scale maps cover a large area in less detail. For example, 1:50000 is a small scale map while 1:10000 is a large-scale map
According to the mode of representation
Verbal scale
Representative Fraction (RF) or Ratio Scale
Bar Scale or Graphic Scale or Linear Scale
Verbal Scale:
“1 centimetre on the map represents 500m on the ground” is a verbal scale. if you plan a route with a total distance of 22cm on the map, it would imply that you’ll be traveling (22cm x 500m) = 11000m or 11km on the ground.
Representative Fraction (RF) / Fractional Scale / Ratio Scale
1:50000 represents the map scale as a mathematical ratio or fraction.
1:50000 can be shown as 1/50000 as well. Here such a scale means that one unit of measurement on the map is equal to 50000 of the same unit on the ground. Such a unit can be anything such as centimetre, meter, feet, inches.
Therefore, 1cm on the map is equal to 50000cm on the ground, that is 1cm on the map is equal to= 500m or 0.5km on the ground.
Bar Scale – Graphic Scale – Linear Scale
Linear scale or graphical scale visually shows the relationship between distances on the map and the real world. Usually, more than one bar scale is shown on the side of the map, each using a different unit of measurement.
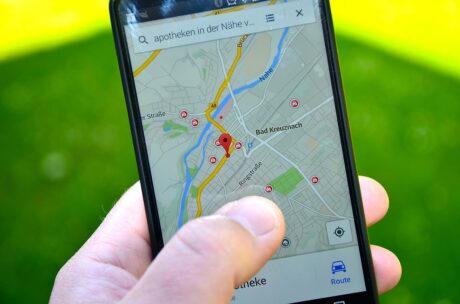
To measure distance on Google Maps one can use the bar scale found on the corner of the map. The scale length and numbers get adjusted automatically as it is zoomed in or out.
Frequently given map scales in IGCSE
means 1cm = 500 m on ground
that is 1cm = 0.5 km or ½ km on ground
Therefore, 2cm on the map is = 1 km on ground
1cm= 250 m on ground
that is 1cm = 0.25 km or ¼ km on ground
Therefore, 4 cm on the map is = 1 km on ground
means 1cm = 100 m on ground
that is 1cm = 0.1 km
Therefore, 10 cm on the map is = 1 km on ground