Setup Menus in Admin Panel

Geographical Skills: 2 & 4th Paper

Types of questions in paper 4

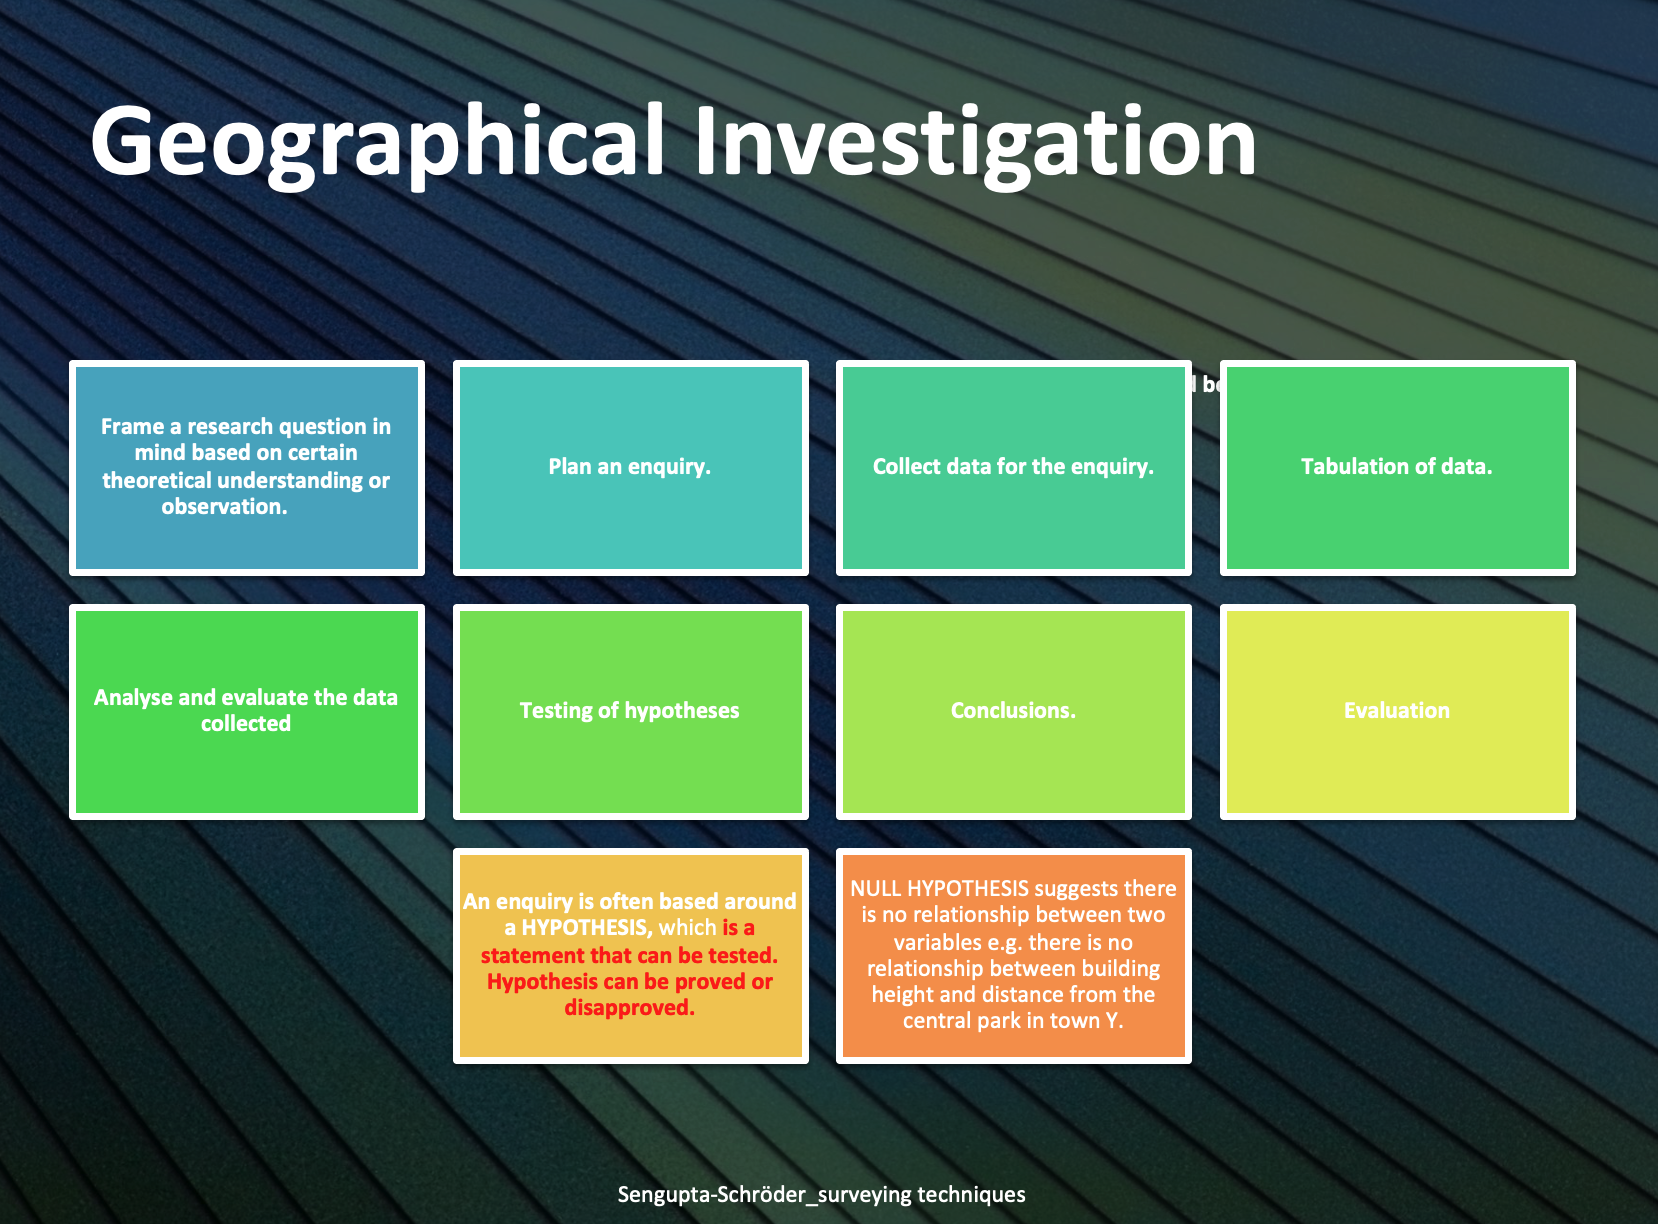
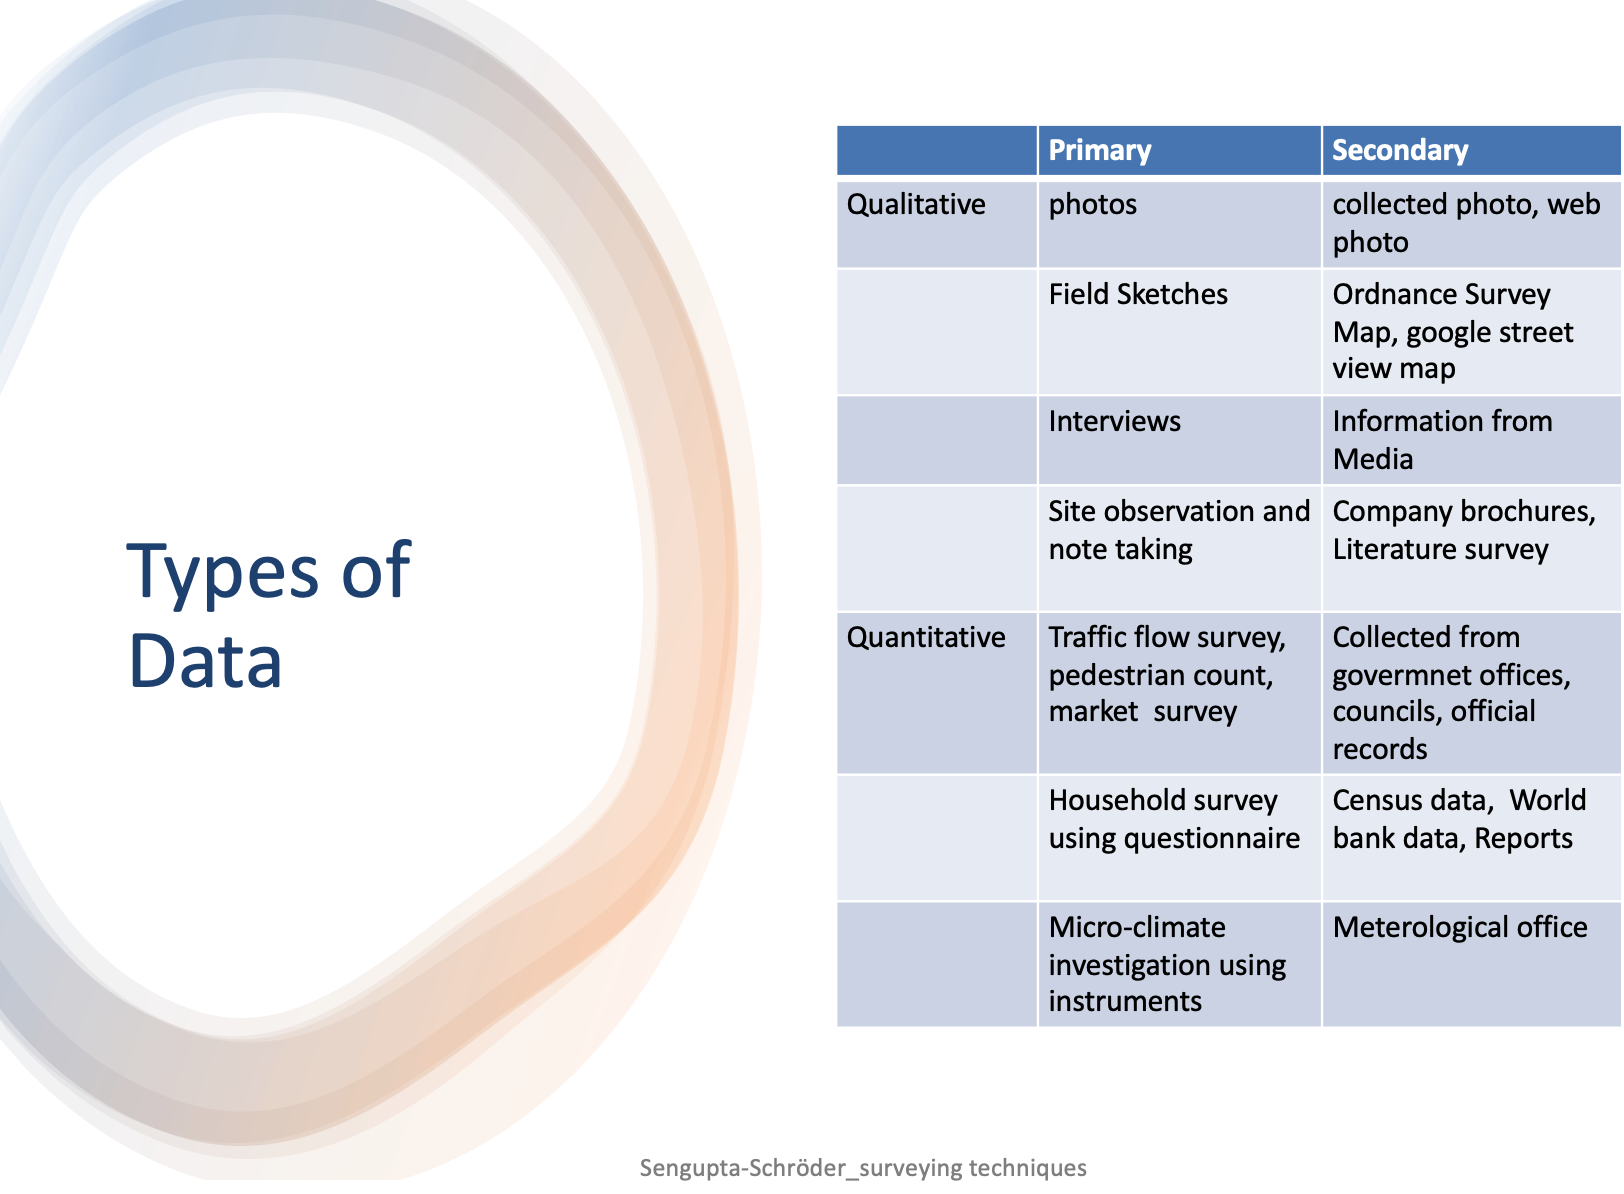
All related to geographical investigation

Hypothesis, questionnaire formulation
Types of data and surveying techniques
Methods of conducting field surveys to collect primary dataSampling, preparation of recording sheets
Plotting data onto maps and graphs, interpreting information from maps and graphs
Calculations, analysis/interpretation of the given data, testing of hypotheses.
Drawing up of conclusion, evaluation.

OS Map And Grid References

What is a Hypothesis?

What is a Null Hypothesis?

What are Primary and Secondary data?

What do quantitative and qualitative data mean? 

Your Tasks

Theme 1: Population and Settlement 

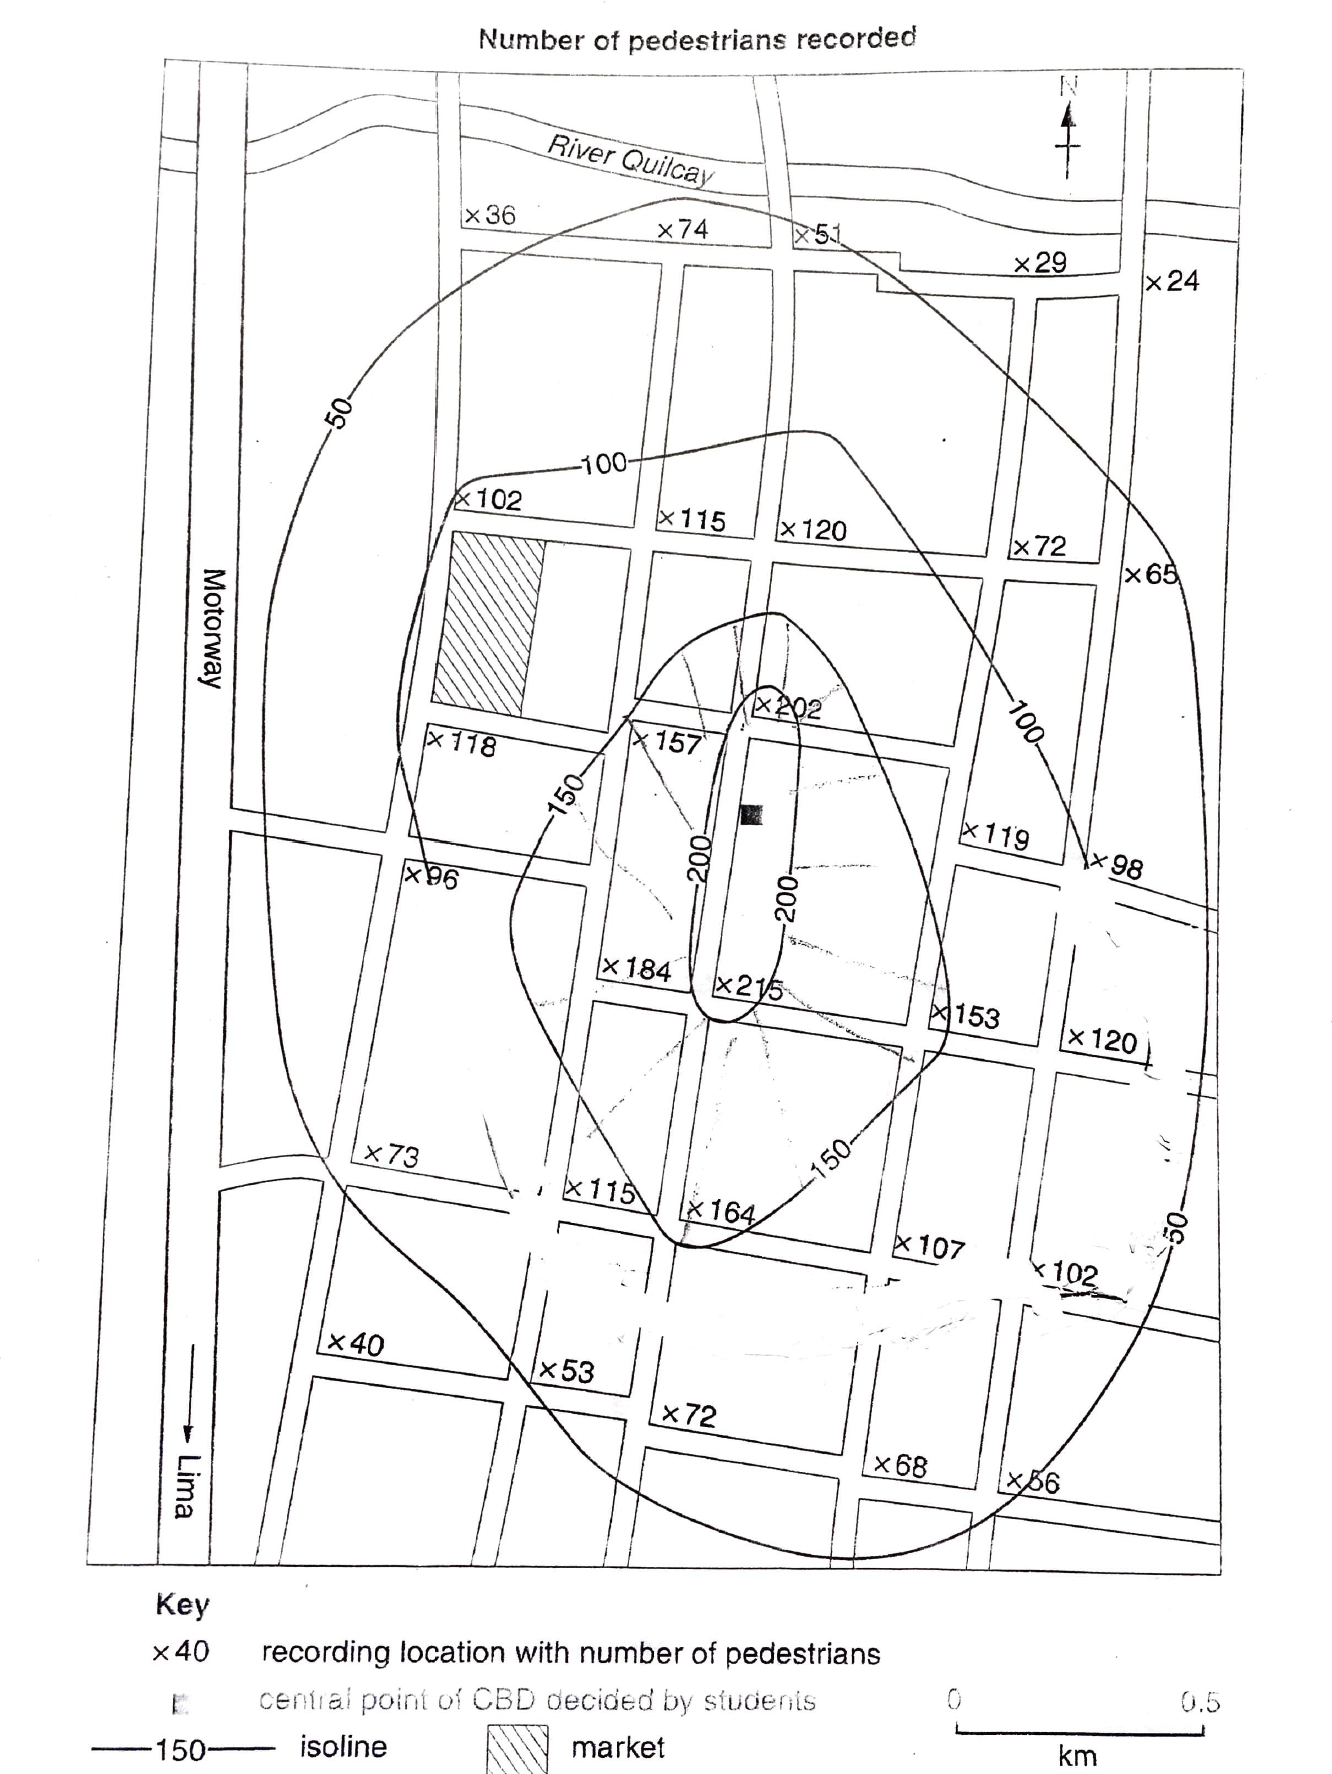
Hypothesis 1: Pedestrian flow decreases away from the centre of the CBD

To Investigate this hypothesis, students worked in pairs to do ‘Pedestrian counts’ at 30 points in the town. They decided all counts would be done between 9:00 a.m. to 9:20 a.m. on the same day.

A.  Give two advantages of this decision.  

(Word Suggestions: Consistency, reliability, enough sampling points to produce sufficient data, peak office hours)

B. Draw a data recording sheet for the pedestrian count

Hypothesis 2: The tallest buildings are located in the CBD.

Students decided to consider 150 pedestrian isoline to mark the edge of the CBD.

A. Is hypothesis 2 is true or false? Justify your decision.

B What are the features of a CBD?

C. What is an isoline?

D. Describe /Explain the shape of the sphere of influence of the super market.

(To describe, just use the compass direction, scale and specific words that depicts the shape that you see in the picture. Explanation needs justification for your description. For example, extends along road as it is easier transport to town, upland sparsely populated means lack of threshold population)

Sampling Techniques

Techniques for Wave Frequency and Wave Height Survey

Setup Menus in Admin Panel

Login

Create an Account Back to login/register