In this lesson we will learn how to transform our subjective world around us into a Geo-lab and making empirical analysis out of our derived DATA. The basic principle is that we need to think ourself as a scientist and must try to stay neutral as far as possible. Being neutral here means without any preconceived notion in mind. Let’s start the simulation!
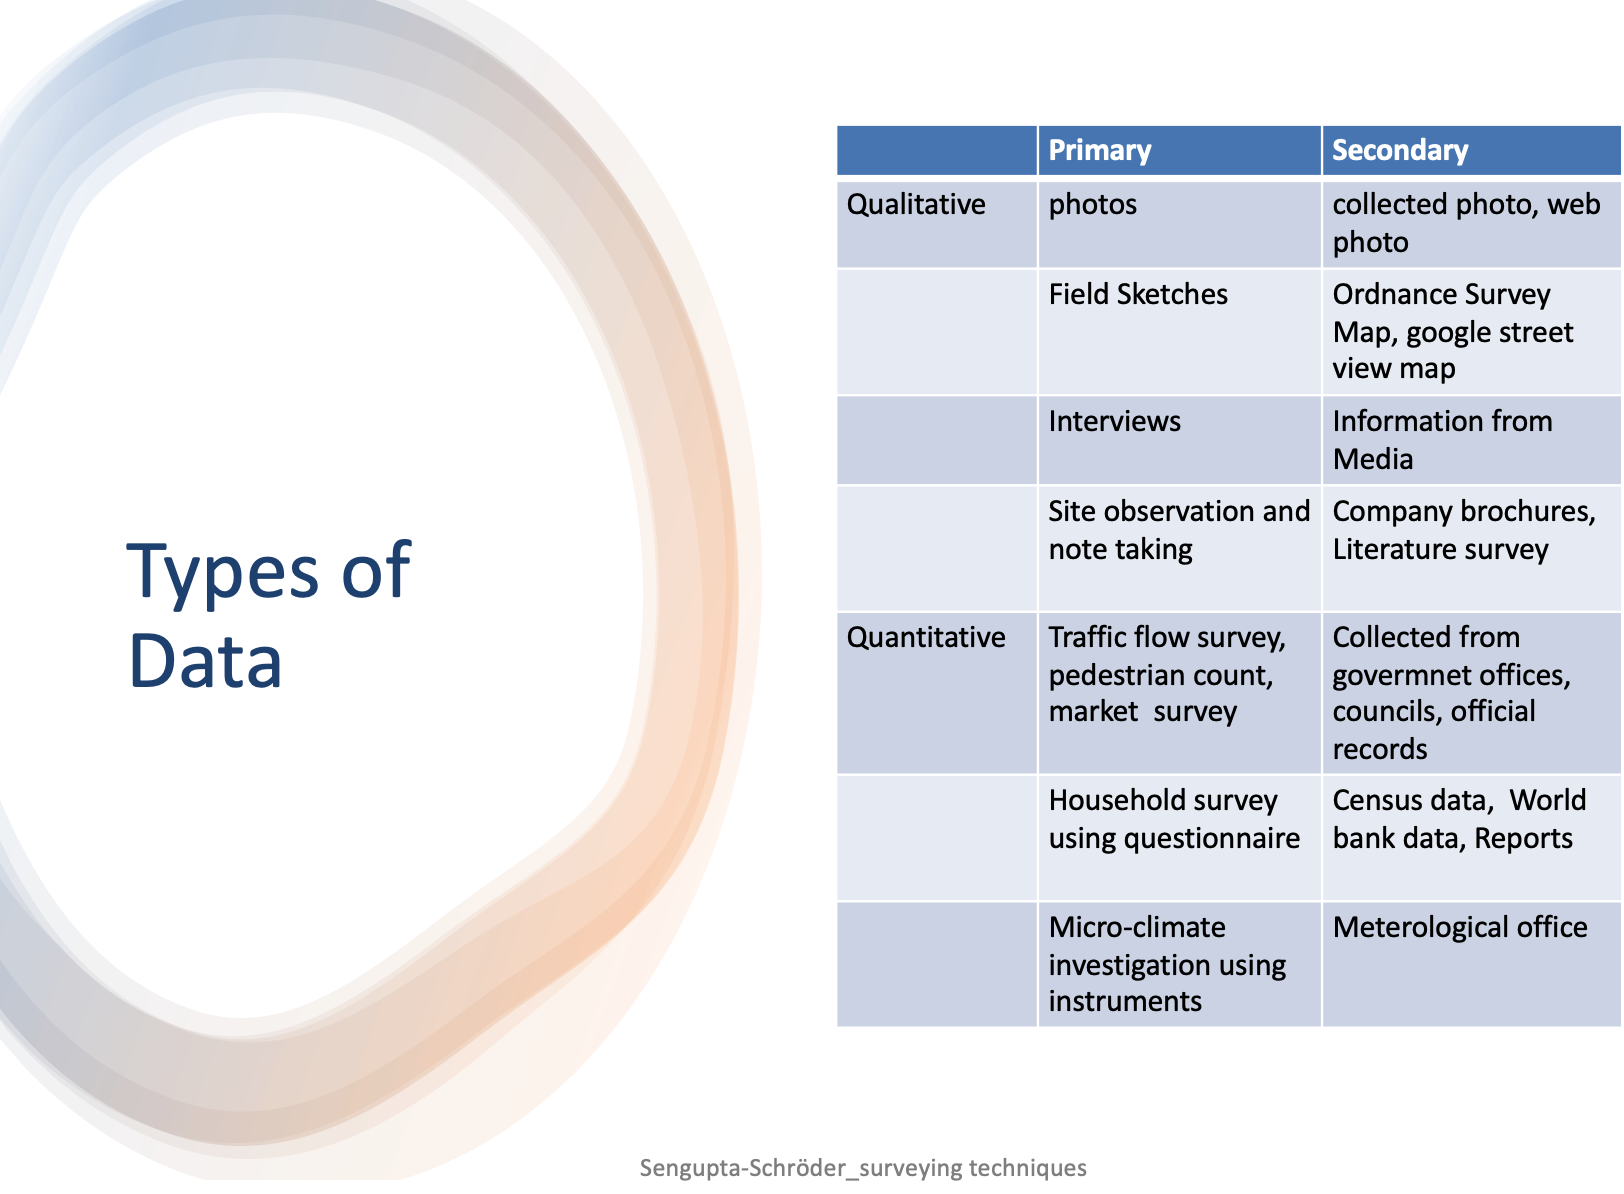
Data?
Prev
Next
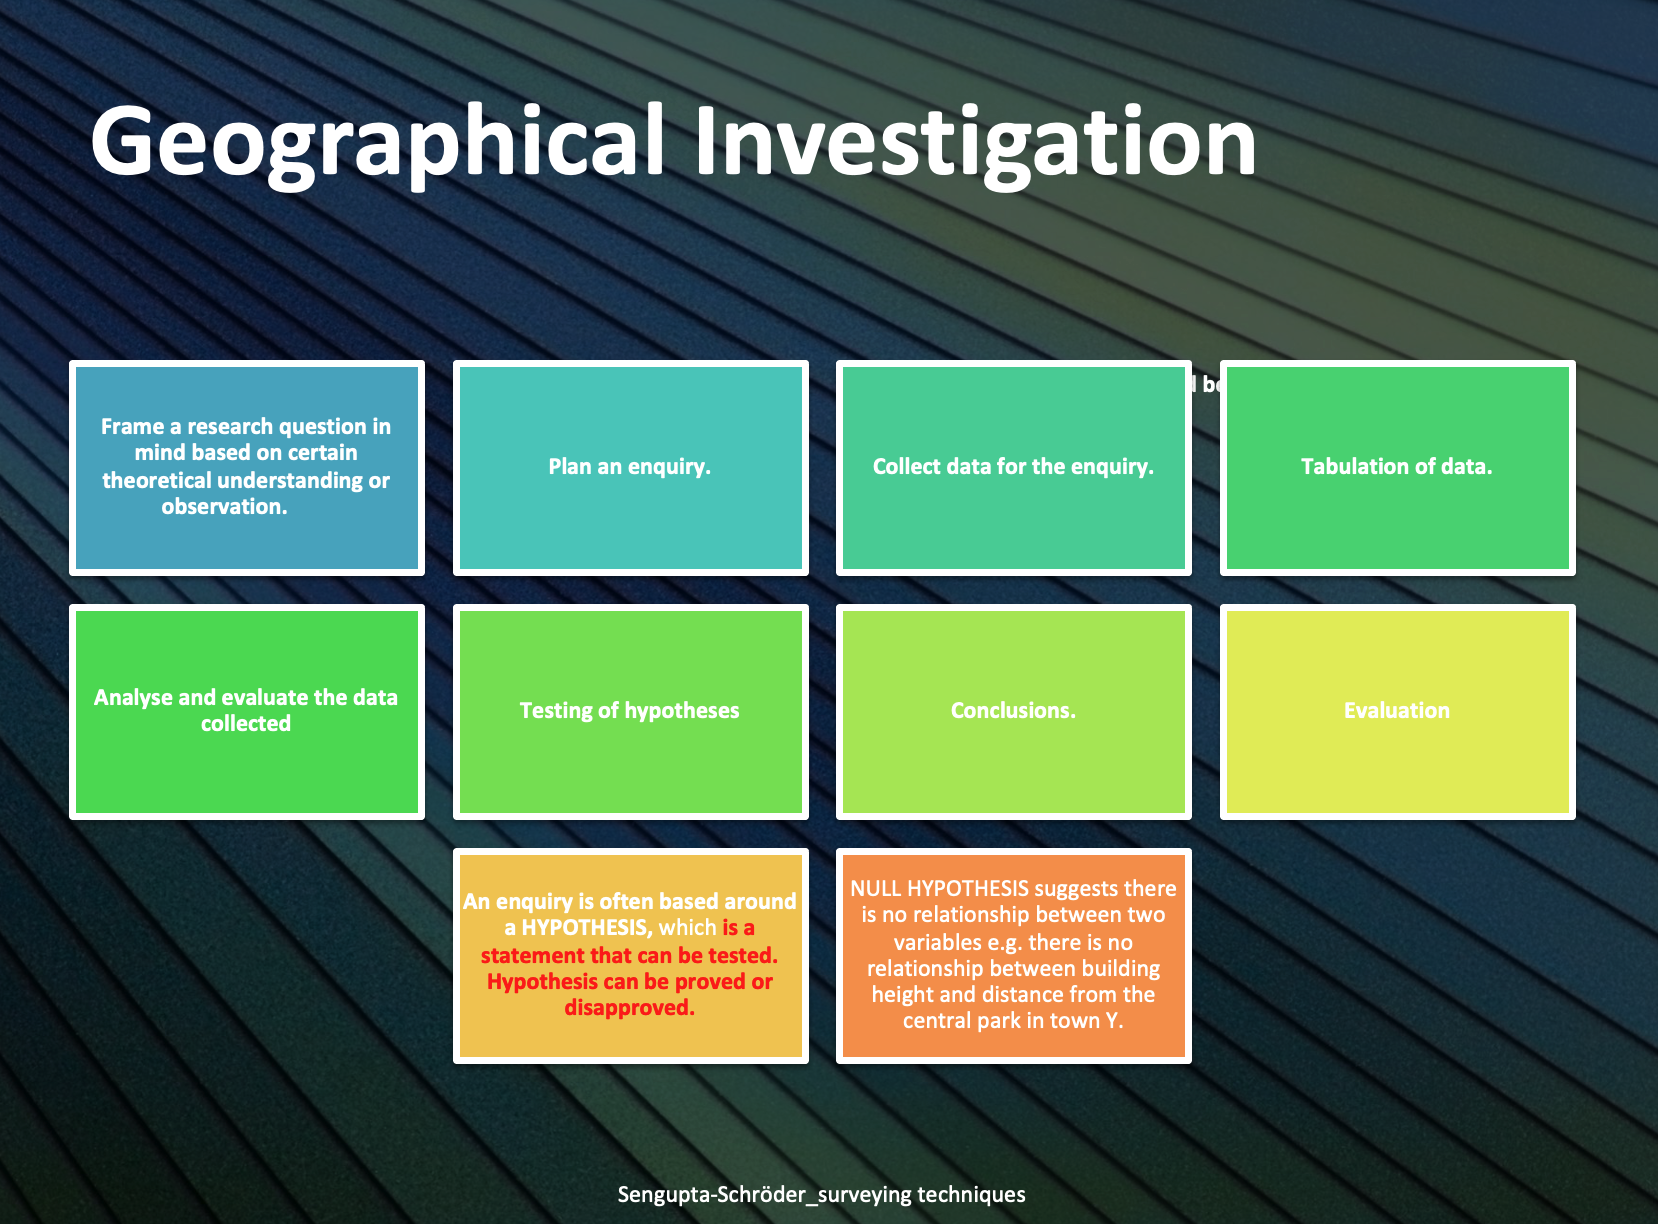
Analysis?

Prev
Next