Prev
Next
Water is one of the most unique molecule known to man
We are comprised of mostly water
Water Crisis: Usage and supply
Guardian report on the access to drinking water around the world
| Terminologies | Explanations | Self Research | Copy right free photos (thanks to the contributors) |
|---|---|---|---|
| Potable water | Water that is free from impurities such as contaminants and bacteria and is thus safe to drink. Huge inequalities persist between and within countries; in Sub- Saharan Africa, almost half of people drink water from unprotected sources. | There’s nothing more essential to life on Earth than safe drinking water. People are struggling to access the quantity and quality of water they need. Amazing progress has been made in making clean drinking water accessible to 2.6 billion people in developing countries from 1990 to 2015. That’s an increase from 76% of the global population to 91% during that time. Yet around 800 million people lack basic drinking water access that is nearly 1 of every 9 people on the planet. Click here for more facts and figures from World Vision. |  |
| Different methods of water supply | The objective of water supply is to take water from its source to the point of its usage. Water supply systems must also meet the requirements for public, commercial, and industrial activities. It generally denotes provision of water by public utilities such as supply of potable water through piped system. Water supply system include infrastructure for the collection, transmission, treatment, storage, and distribution of water for domestic, agriculture (including irrigation) and other commercial purposes as well as for special public needs as firefighting etc. Nearly 90% of the global population has access to piped water supply. A fraction of them also possess their own house supply such as protected wells or boreholes besides the municipal supply. Look at the next column for the the major methods of water supply. | 1. Dam and reservoir: Dams are the barriers that controls the flow of the excess water, normally built across a river. Reservoirs are man made artificial lakes behind a dam that store water. They can be 'on channel' or 'off channel'. 2. Wells and boreholes: These are the methods of trapping ground water (Aquifer). Wells are relatively of larger diameter than boreholes. Aquifer provides nearly half of the global drinking water supply. 3. Desalinization plants: In this expensive process salt from the sea water is removed by distilling water using boiling process. This process is widely used in the wealthy Middle East countries where waste gasses from the oil wells are used to distill water. 4. Rain water harvesting: This includes collection and storing of rainwater for future use. Click here for more relevant information on the water supply system. | Water stress: When water supply is below 1700 cubic meters per person per year. Water scarcity affects every continent. Infographics from Waterlogic: Source 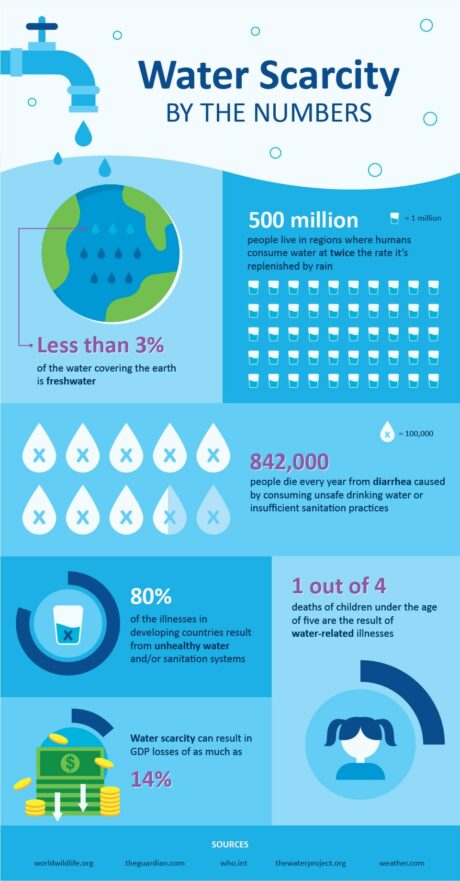 Click here to learn more about the problem of water crisis from Water.org. |
| Water security | When all people in a society have sustainable access to adequate quantities of safe clean water for livelihood and development. | Read: Elements of water security from ResearchGate | |
| Food security | Stable supply as well as physical, social, and economic access to sufficient, safe and nutritious food to meet the dietary needs of a population. | 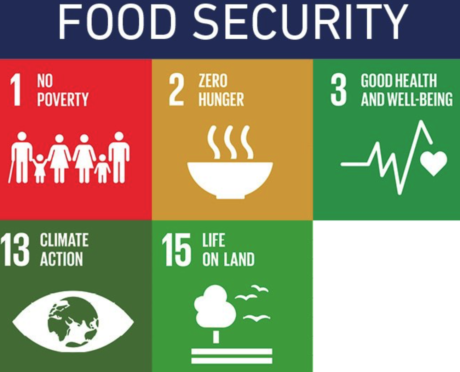 | 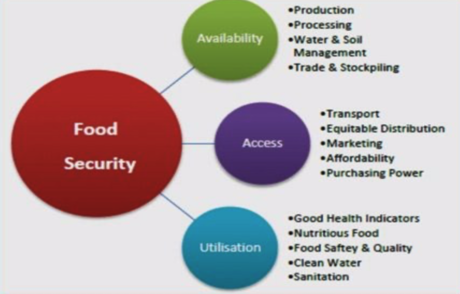 |
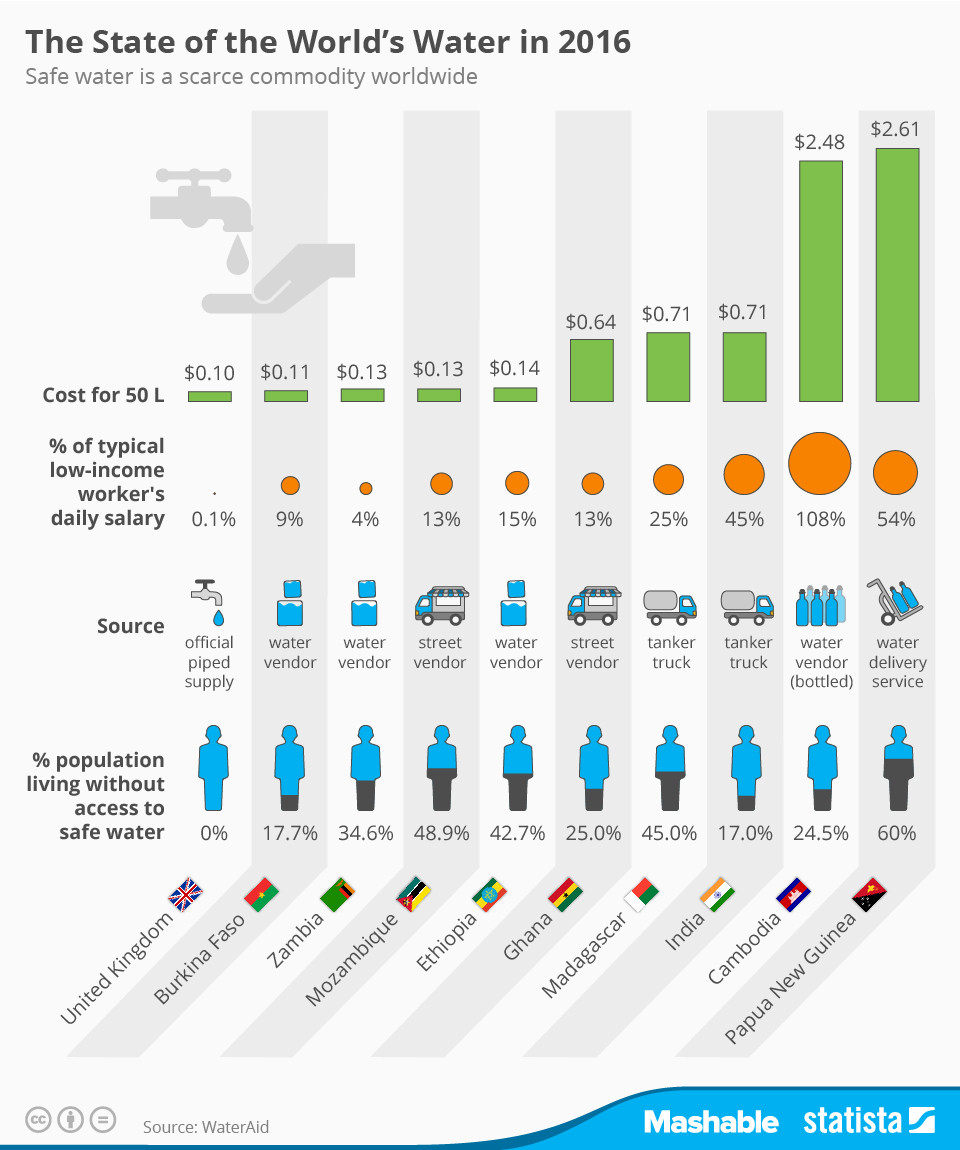 You will find more infographics at Statista
It is the amount of water that is required to produce food or any other product that we use and to transport it to the market and thus essentially embedded in the item. For example, 1 kg of wheat takes around 1000 liters of water to produce, so the import of this amount of wheat to another country will save the amount of water it requires to produce that item domestically, however it will increase the country’s virtual water consumption and related water footprint. Greater liberalization of trade in agricultural products would further increase virtual water flow between the countries. The concept of virtual water therefore also refers to the way in which water is transferred from one country to another. According to the Guardian Report on an average 400 liters of water is required to produce 1 liter of Coca-cola.
The world’s population is growing by roughly 80 million people each year. Changes in lifestyles and eating habits in recent years are requiring more water consumption per capita, putting a stress on the available fresh water resources. People in high income countries consume greater amount of virtual water than in low income countries because of different lifestyle and diet. Agriculture accounts for nearly 70% of all water consumption, compared to 20% for industry and 10% for household water consumption.
Gallon to Liter conversion 1 gallon = 3.7 liters
Water footprint comparison by countries
Water Footprint Calculator: Know what is your water footprint
Review WaterStat data: one of the world’s most comprehensive water footprint database
| Commodities | Virtual / embedded water (average including production of raw materials and manufacturing) |
| 1 can of Cola (300ml) | 200 liters |
| 1 cotton shirt | 3000 liters |
| 1 pair of leather shoes | 8000 liters |
| 1 pair of Jeans | 760 liters |
| 1 smartphone | 900 liters |
| 1 cup of tea (300ml) | 35 liters |
| 1 cup of coffee (300ml) | 140 liters |
| 1 liter of bio fuel | 4000 liters |
| 1 hamburger | 2400 liters |
| Comparison by country | Average water footprint per person per day |
| UAE | 8500 liters |
| USA | 8300 liters |
| Canada | 6400 liters |
| EU | 4600 liters |
Source of the data: WHO, 2019
| Natural Capital | Those goods and services that are not manufactured but have values to human, e.g. Soil, water, trees, living organisms etc. |
| Non-renewable energy | Exist in finite amount and are not renewed after they have been depleted, e.g. fossil fuels. These are forms of stored solar energy produced by photosysthesis (coal) and remains of organic life from millions of years ago, now being extracted and burned by humans. |
| Renewable energy | Can be used over and over again and are considered to be sustainable, e.g. Solar, wind, geothermal energy etc. |
| Replenishable resources | Are middle ground between renewable and non-renewable resources. They tend to be replaced over a long period of time. If the depletion rate is larger than recharge rate, the natural capital is depleted. E.g. Fuel wood. |
| Energy security | When all people in a society/country enjoy the uninterrupted supply of energy they require to meet their needs at an affordable price. |