Setup Menus in Admin Panel

Environmental and social stresses

Urban Microclimate

Your Task

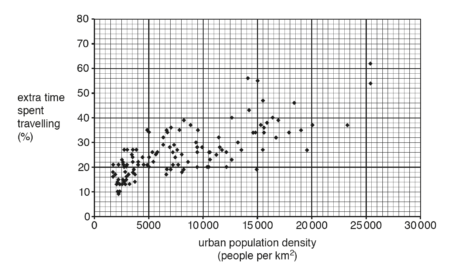
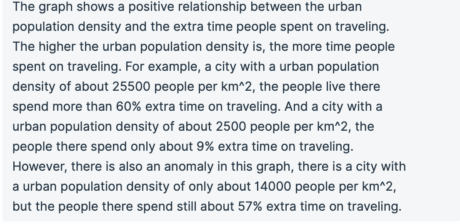
Describe the relationship shown in the graph between urban population density and the extra time spent on traveling. Use statistics in your answer. (4 marks)

Example from the Student’s work

Urban Microclimate

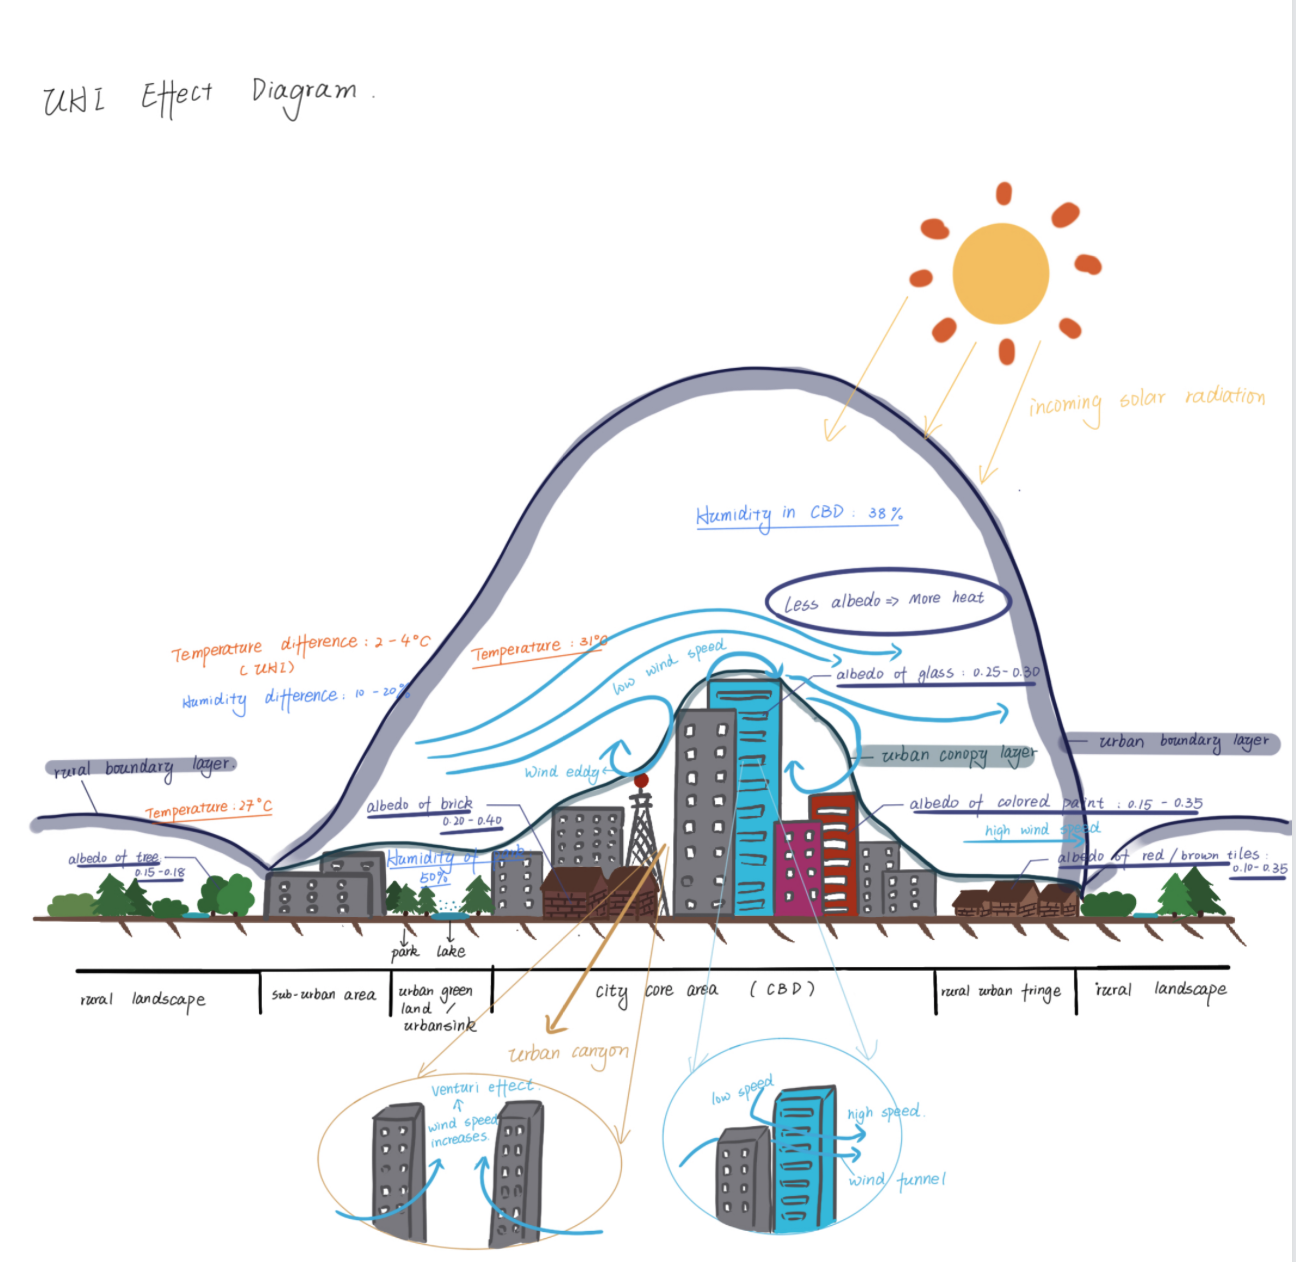
Cities create their own climate and weather conditions (small scale variations). This is also known as climatic dome effect within which the weather is different from that of the surrounding rural areas in terms of temperature, relative humidity, precipitation, visibility and wind speed.

Within the urban climatic dome two levels can be recognized

  1. Urban canopy- below roof level and spaces between buildings
  2. Urban boundary layer- above the urban canopy layer.


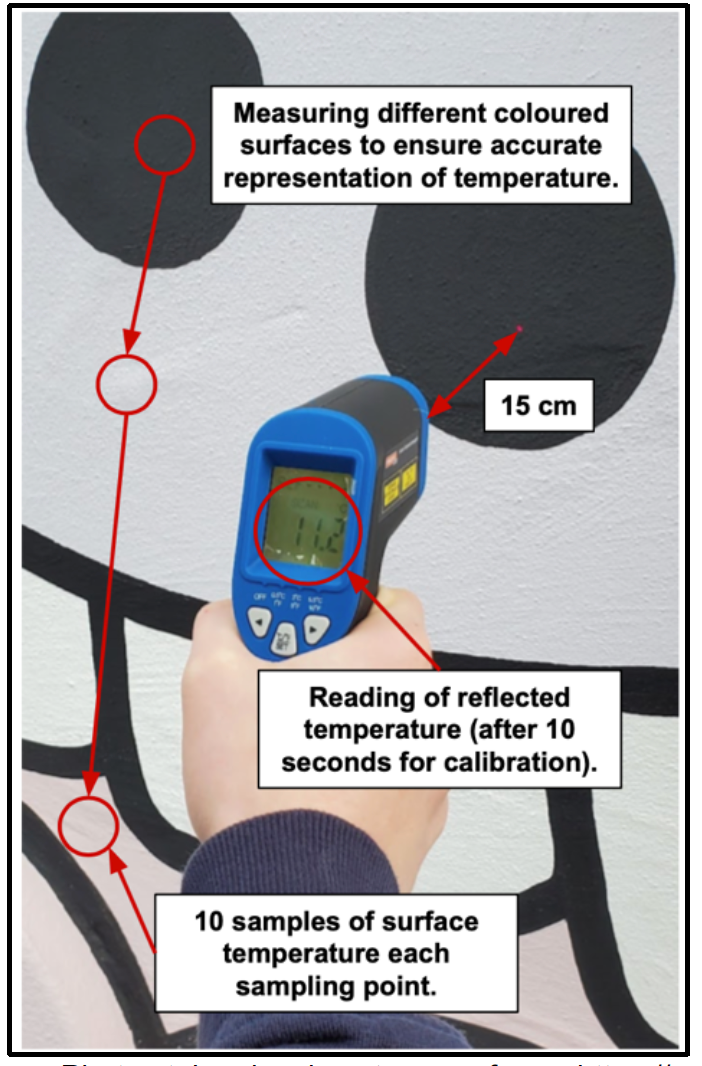
Factors affecting urban microclimate

Population and consumption pattern: Population density, and consumption pattern eg. use of air conditioning, volume of traffic and level and type of pollutions, pattern of energy used, Power stations and location of polluting industries etc.

Local topography and physical landscape: Prevailing wind and air pressure, valley structure inducing temperature inversion.

Density and patterns of concrete surfaces: Building structure, design, size, spacing and materials, presence of park and open spaces.

Existence of water bodies and forest: Fringe forest, green belt, distance from water bodies.

Temperature

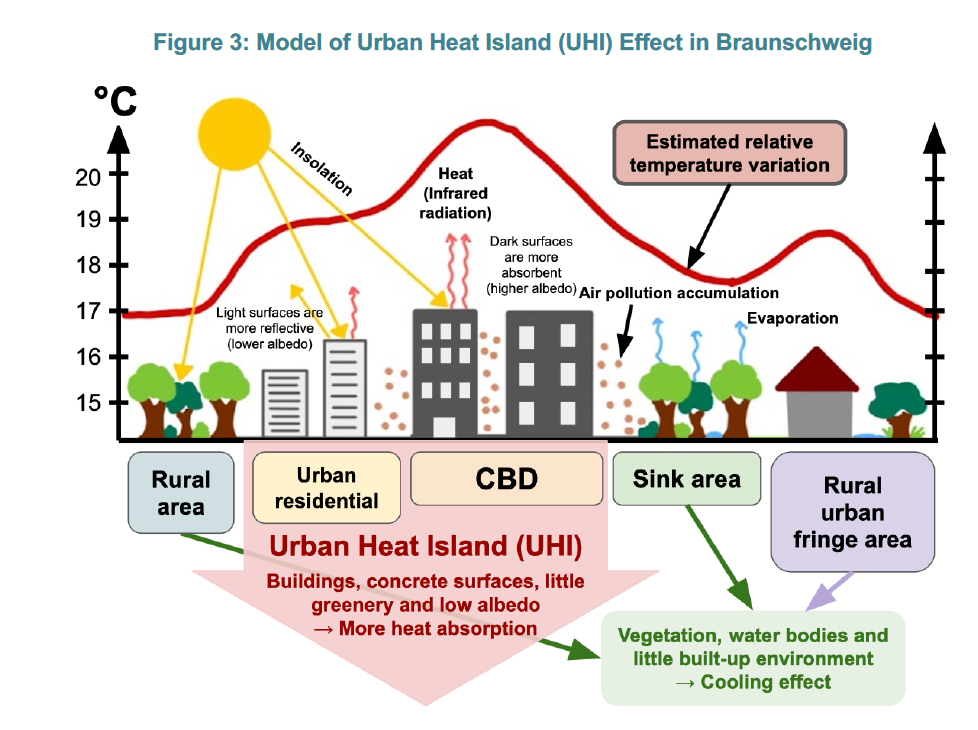
Urban Heat Island (UHI) effect

Urban heat island signifies the temperature differences between the urban and rural areas. Urban areas are generally 2 to 4 degree C warmer than those of the surrounding countryside, depending upon the size and character of the city. An urban area can be identified as a warm spot in the sea of the surrounding cooler rural air mass.

Cities tend to be warmer than the surrounding rural areas for the following reasons:

  • Building materials such as concrete, bricks and tarmac absorb large amount of heat and affect the urban Albedo.  Albedo is the amount of insolation reflected by the earth surface and atmosphere. Highly reflective surfaces absorb very little insolation and reflect it back into the atmosphere, keeping the urban areas cool. Darker surfaces like tarmac tend to absorb insolation more and then reradiate as long wave energy that heats up the urban area.
  • Temperature rises steadily to a peak in the CBD where building densities are highest. There could be a second cliff after the cliff at the CBD. This is mainly due to the difference in land use pattern between the city environment (built up surface) and adjoining countryside (farm land or forest)
  • There are variations that reflect the distribution of industries, power stations; water bodies and open spaces (generate cooling effect due to dispersion of pollutants). Heat comes from industries, buildings (domestic heating, air conditioning) and vehicles which all burn fuel.
  • In winter, rural areas keep snow for much longer period and therefore generate a greater albedo.

Impact of UHI

  • Elevated environmental problems- high level of ozone and suspended particles , photochemical smog
  • Compromised human health and comfort – Heat cause serious problems for elderly and children, heat stress and illness, high temperature increases the likelihood of vector and waterborne diseases.
  • Increased energy consumption- urban heat islands raise demand for electrical energy in summer like air conditioning etc. Companies that supply electricity typically rely on fossil fuel power plants to meet much of this demand, which in turn leads to an increase in air pollutant and greenhouse gas emissions.


Humidity and precipitation

  • Overall, relative humidity (amount of moisture available) is low in cities than in rural areas as there are fewer water bodies and sparser vegetation cover cause lower rates of evapotranspiration. In the cities, precipitation is directly channeled into drains and is hardly absorb by the concrete surfaces.
  • Urban heat island generates convection and high-rise building promotes vertical motion, creating stronger thunderstorm in summer.

Winds

Size and shape of the buildings affect wind pattern in the cities. Air is forced to rise upward and is displaced side wards on the windward side of the buildings. On the other hand, it is pushed downwards at the leeward side of the structure (refer to the diagram). The uneven surface area of the cities due to varying structures and skyscrapers generate frictional drag on air moving over and around them.

  • Varying height of buildings creates turbulence and abrupt change in wind direction and speed.
  • High rise building channel air into canyons (strong wind) between them. Canyons are created due to the Venturi effect in which the pressure difference between the gap of the high rise buildings cause the wind to pick up speed and reach high velocities. Airflow at the street level is necessary to dilute harmful pollution. Efficient building design with tilts and wind passage can solve this problem to some extent. For example, pollution emitter pipe or chimneys should be constructed high enough to ensure that the pollutants are released into the undisturbed boundary layer above the buildings and not into the eddies.

Urban heat island effect

Urban Canyon effect

Wind-flow patterns in cities: Down draft and Venturi effect

Smog in Chinese cities

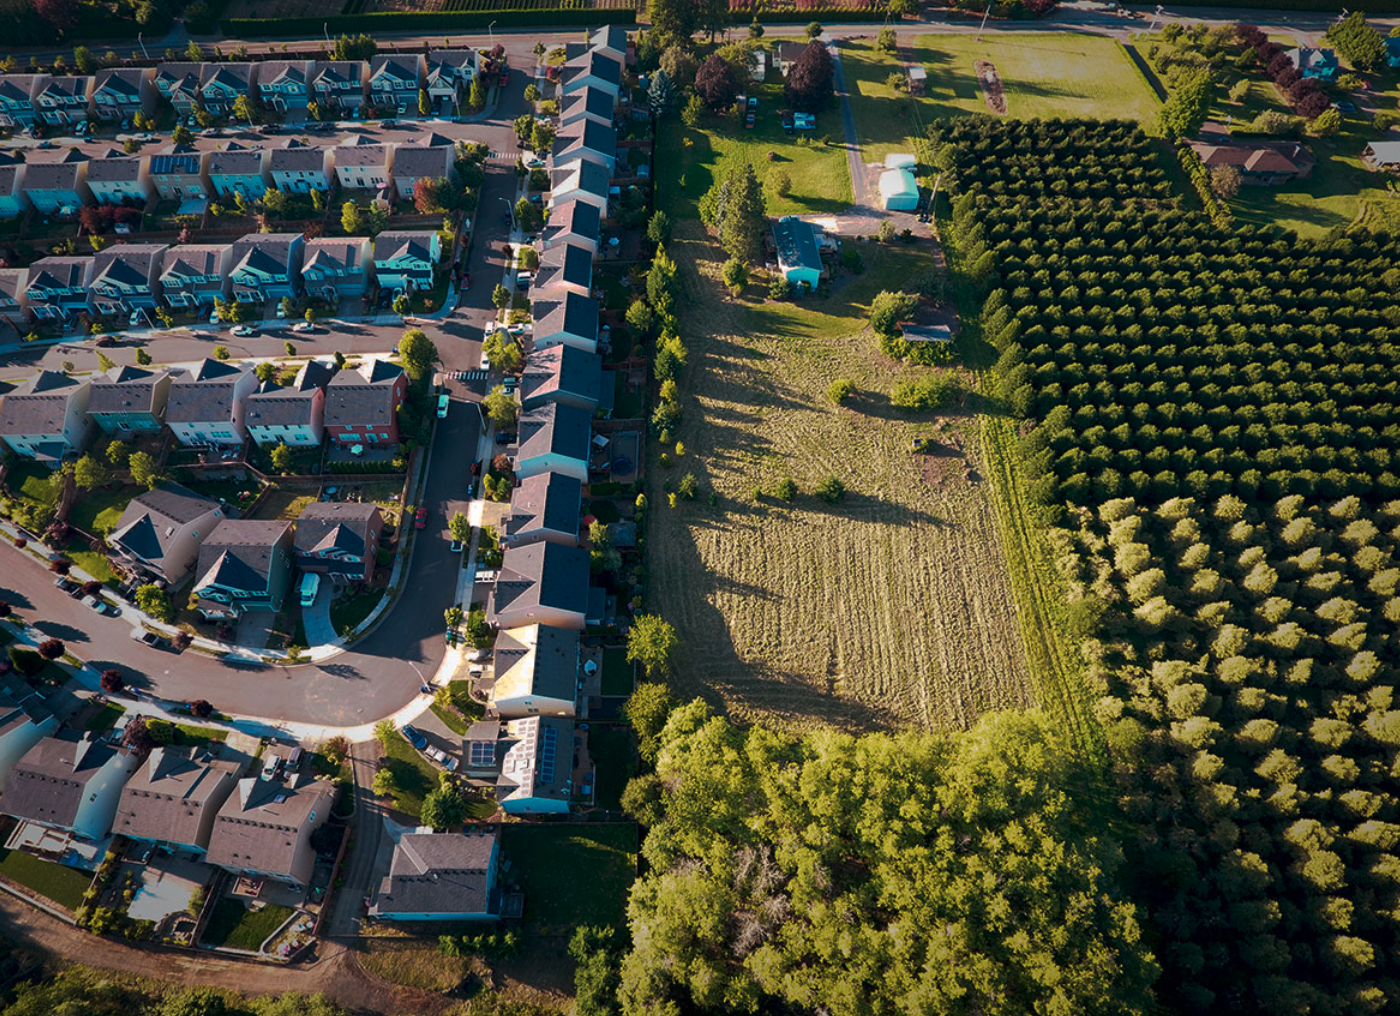
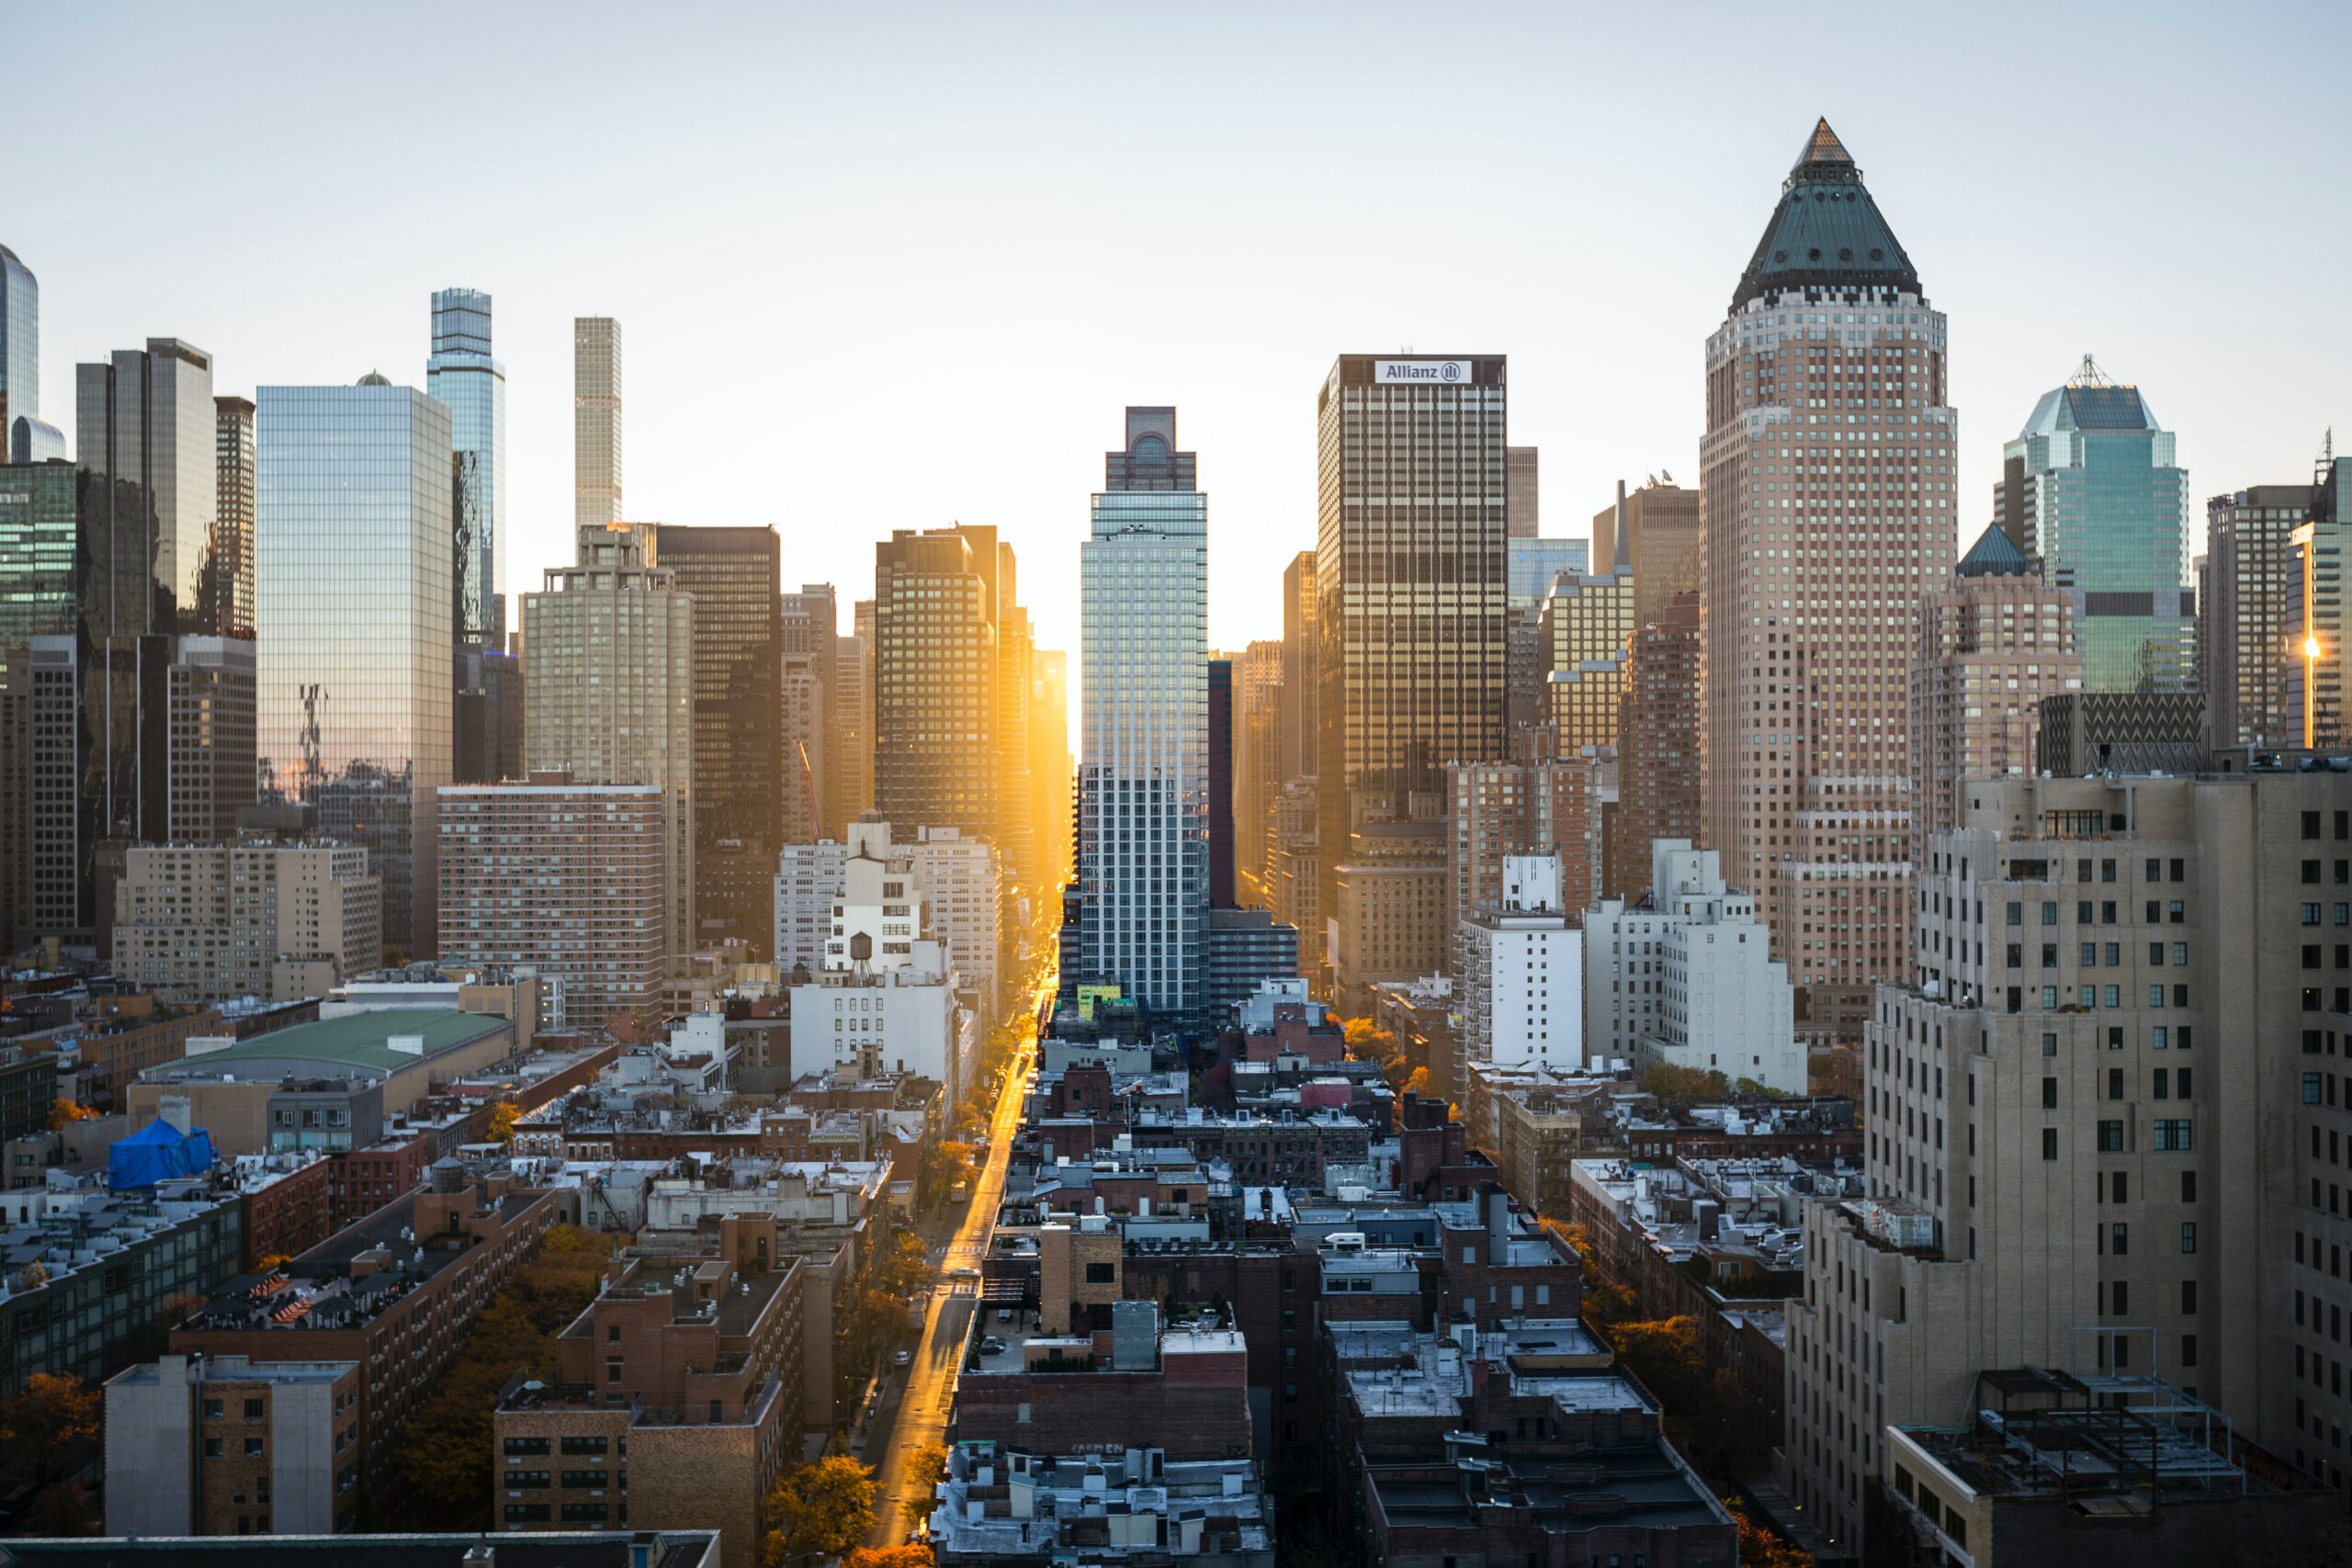
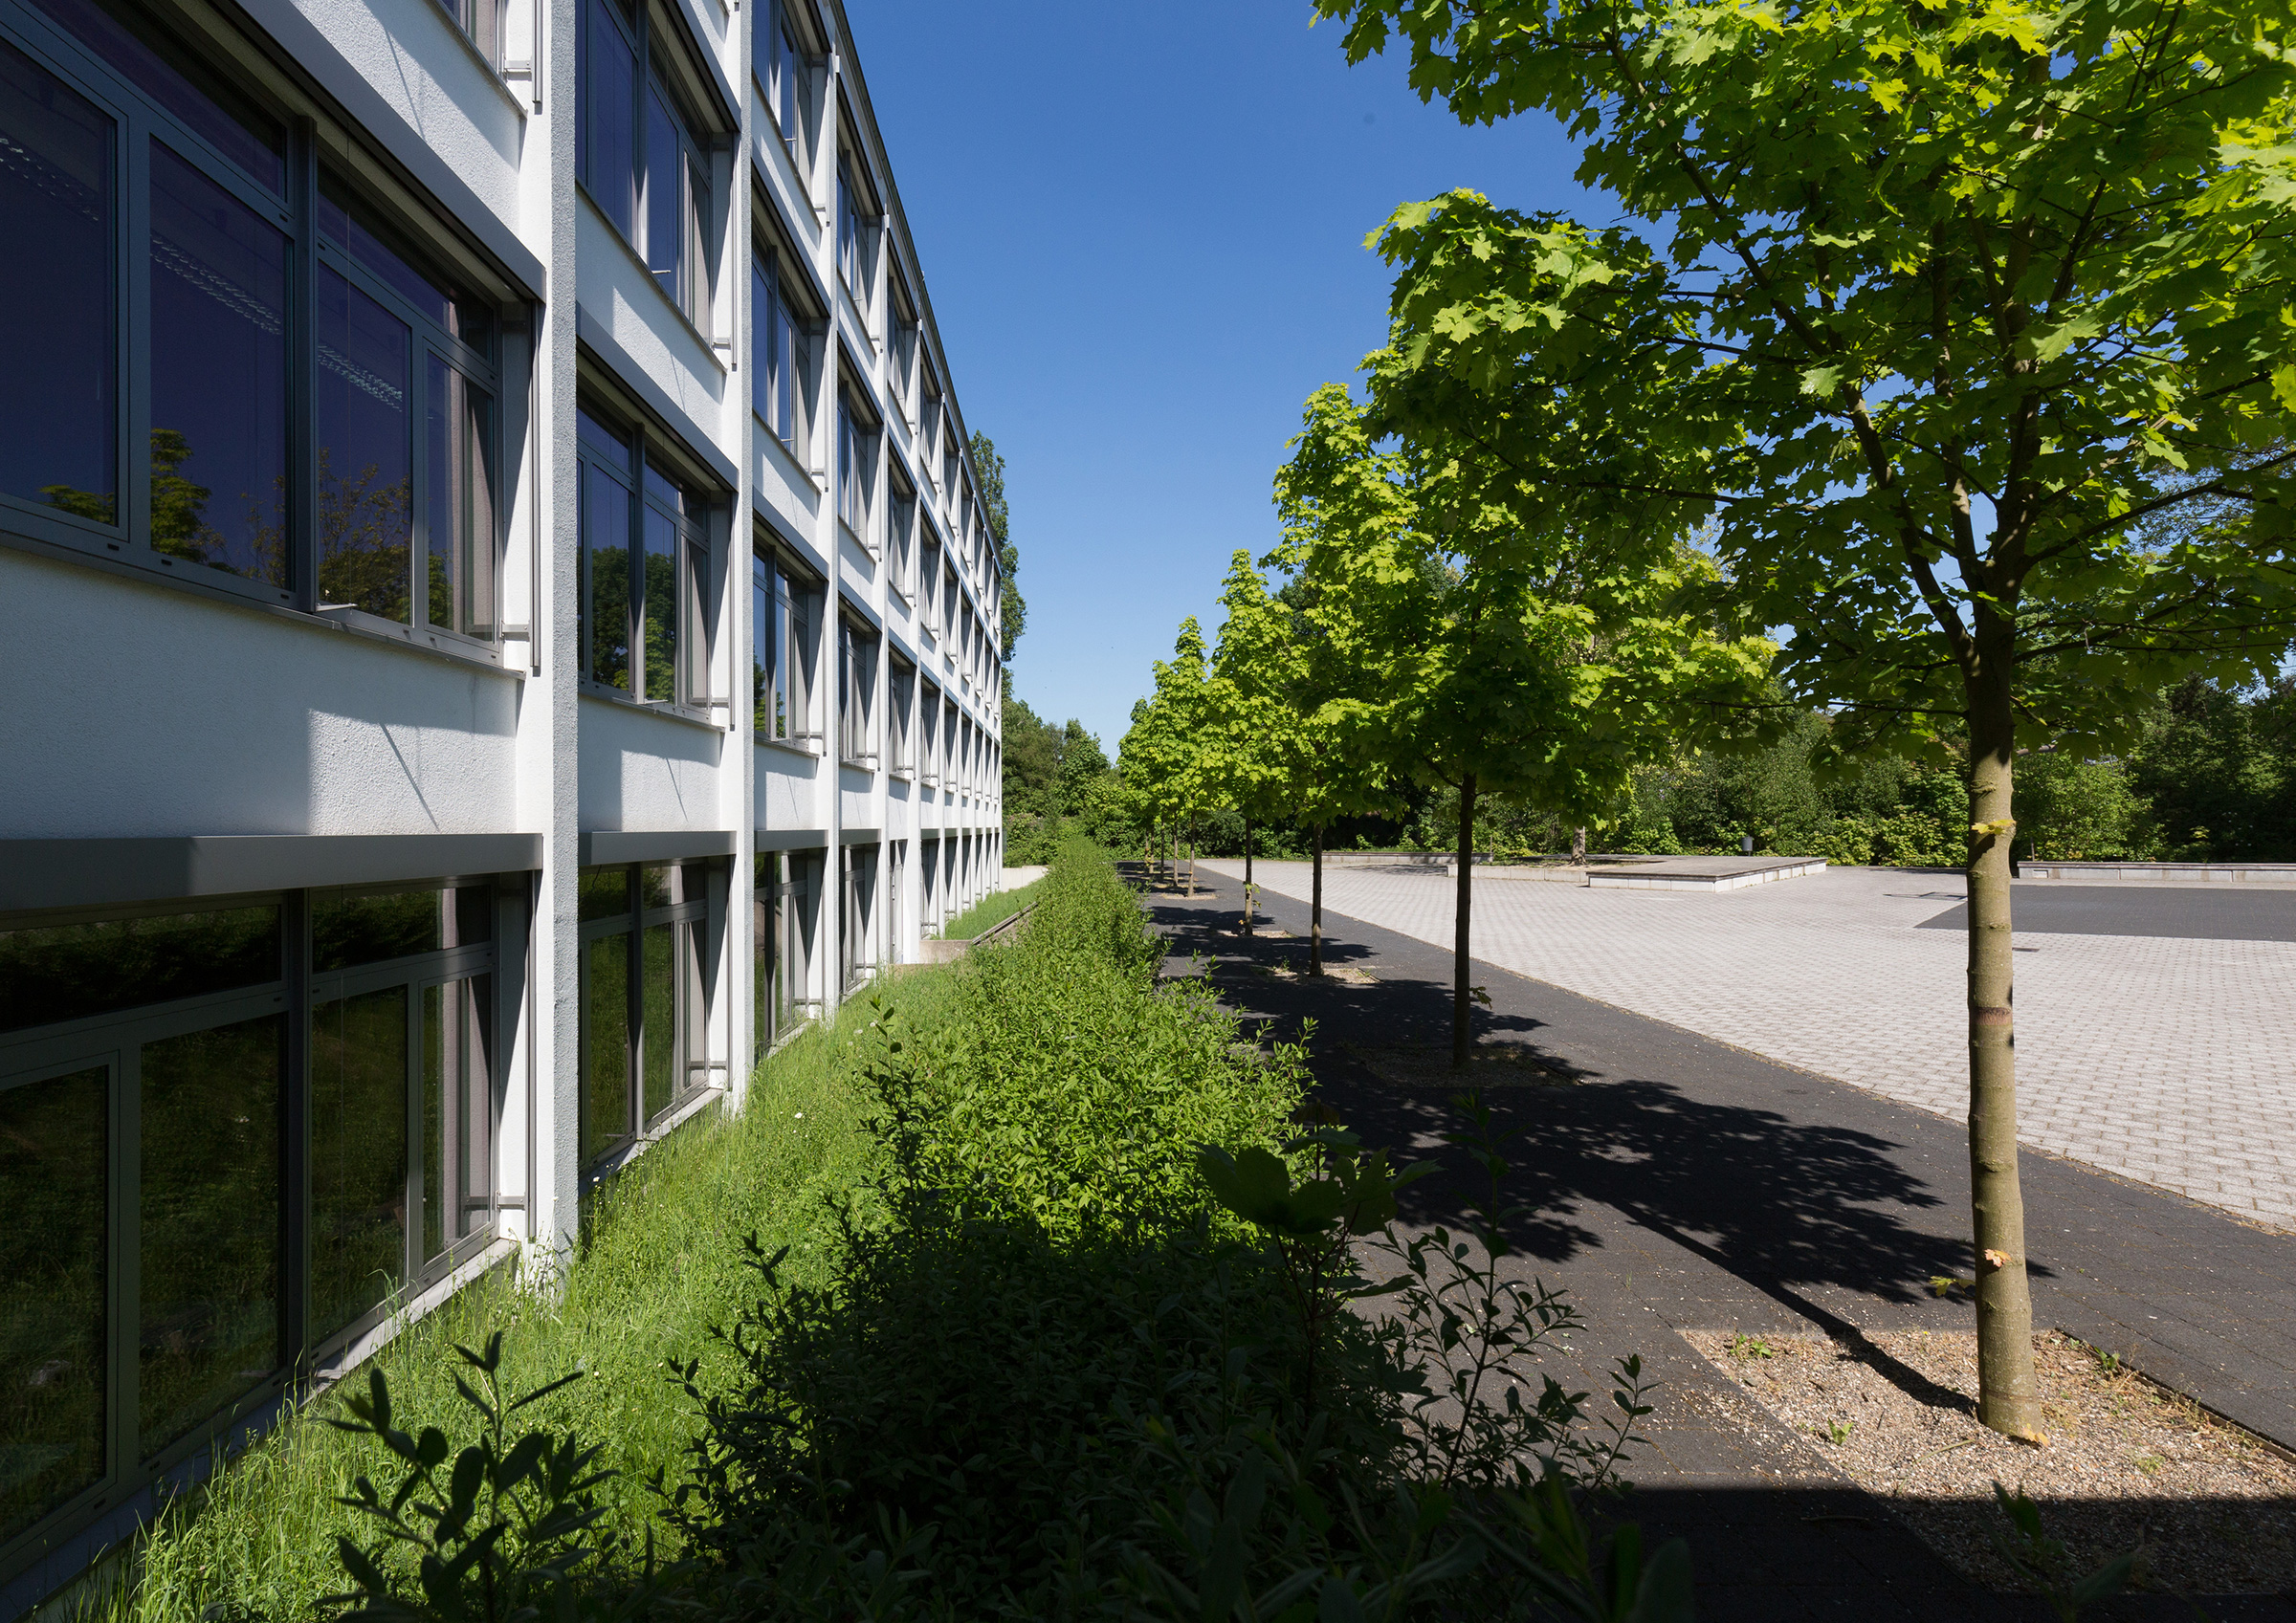
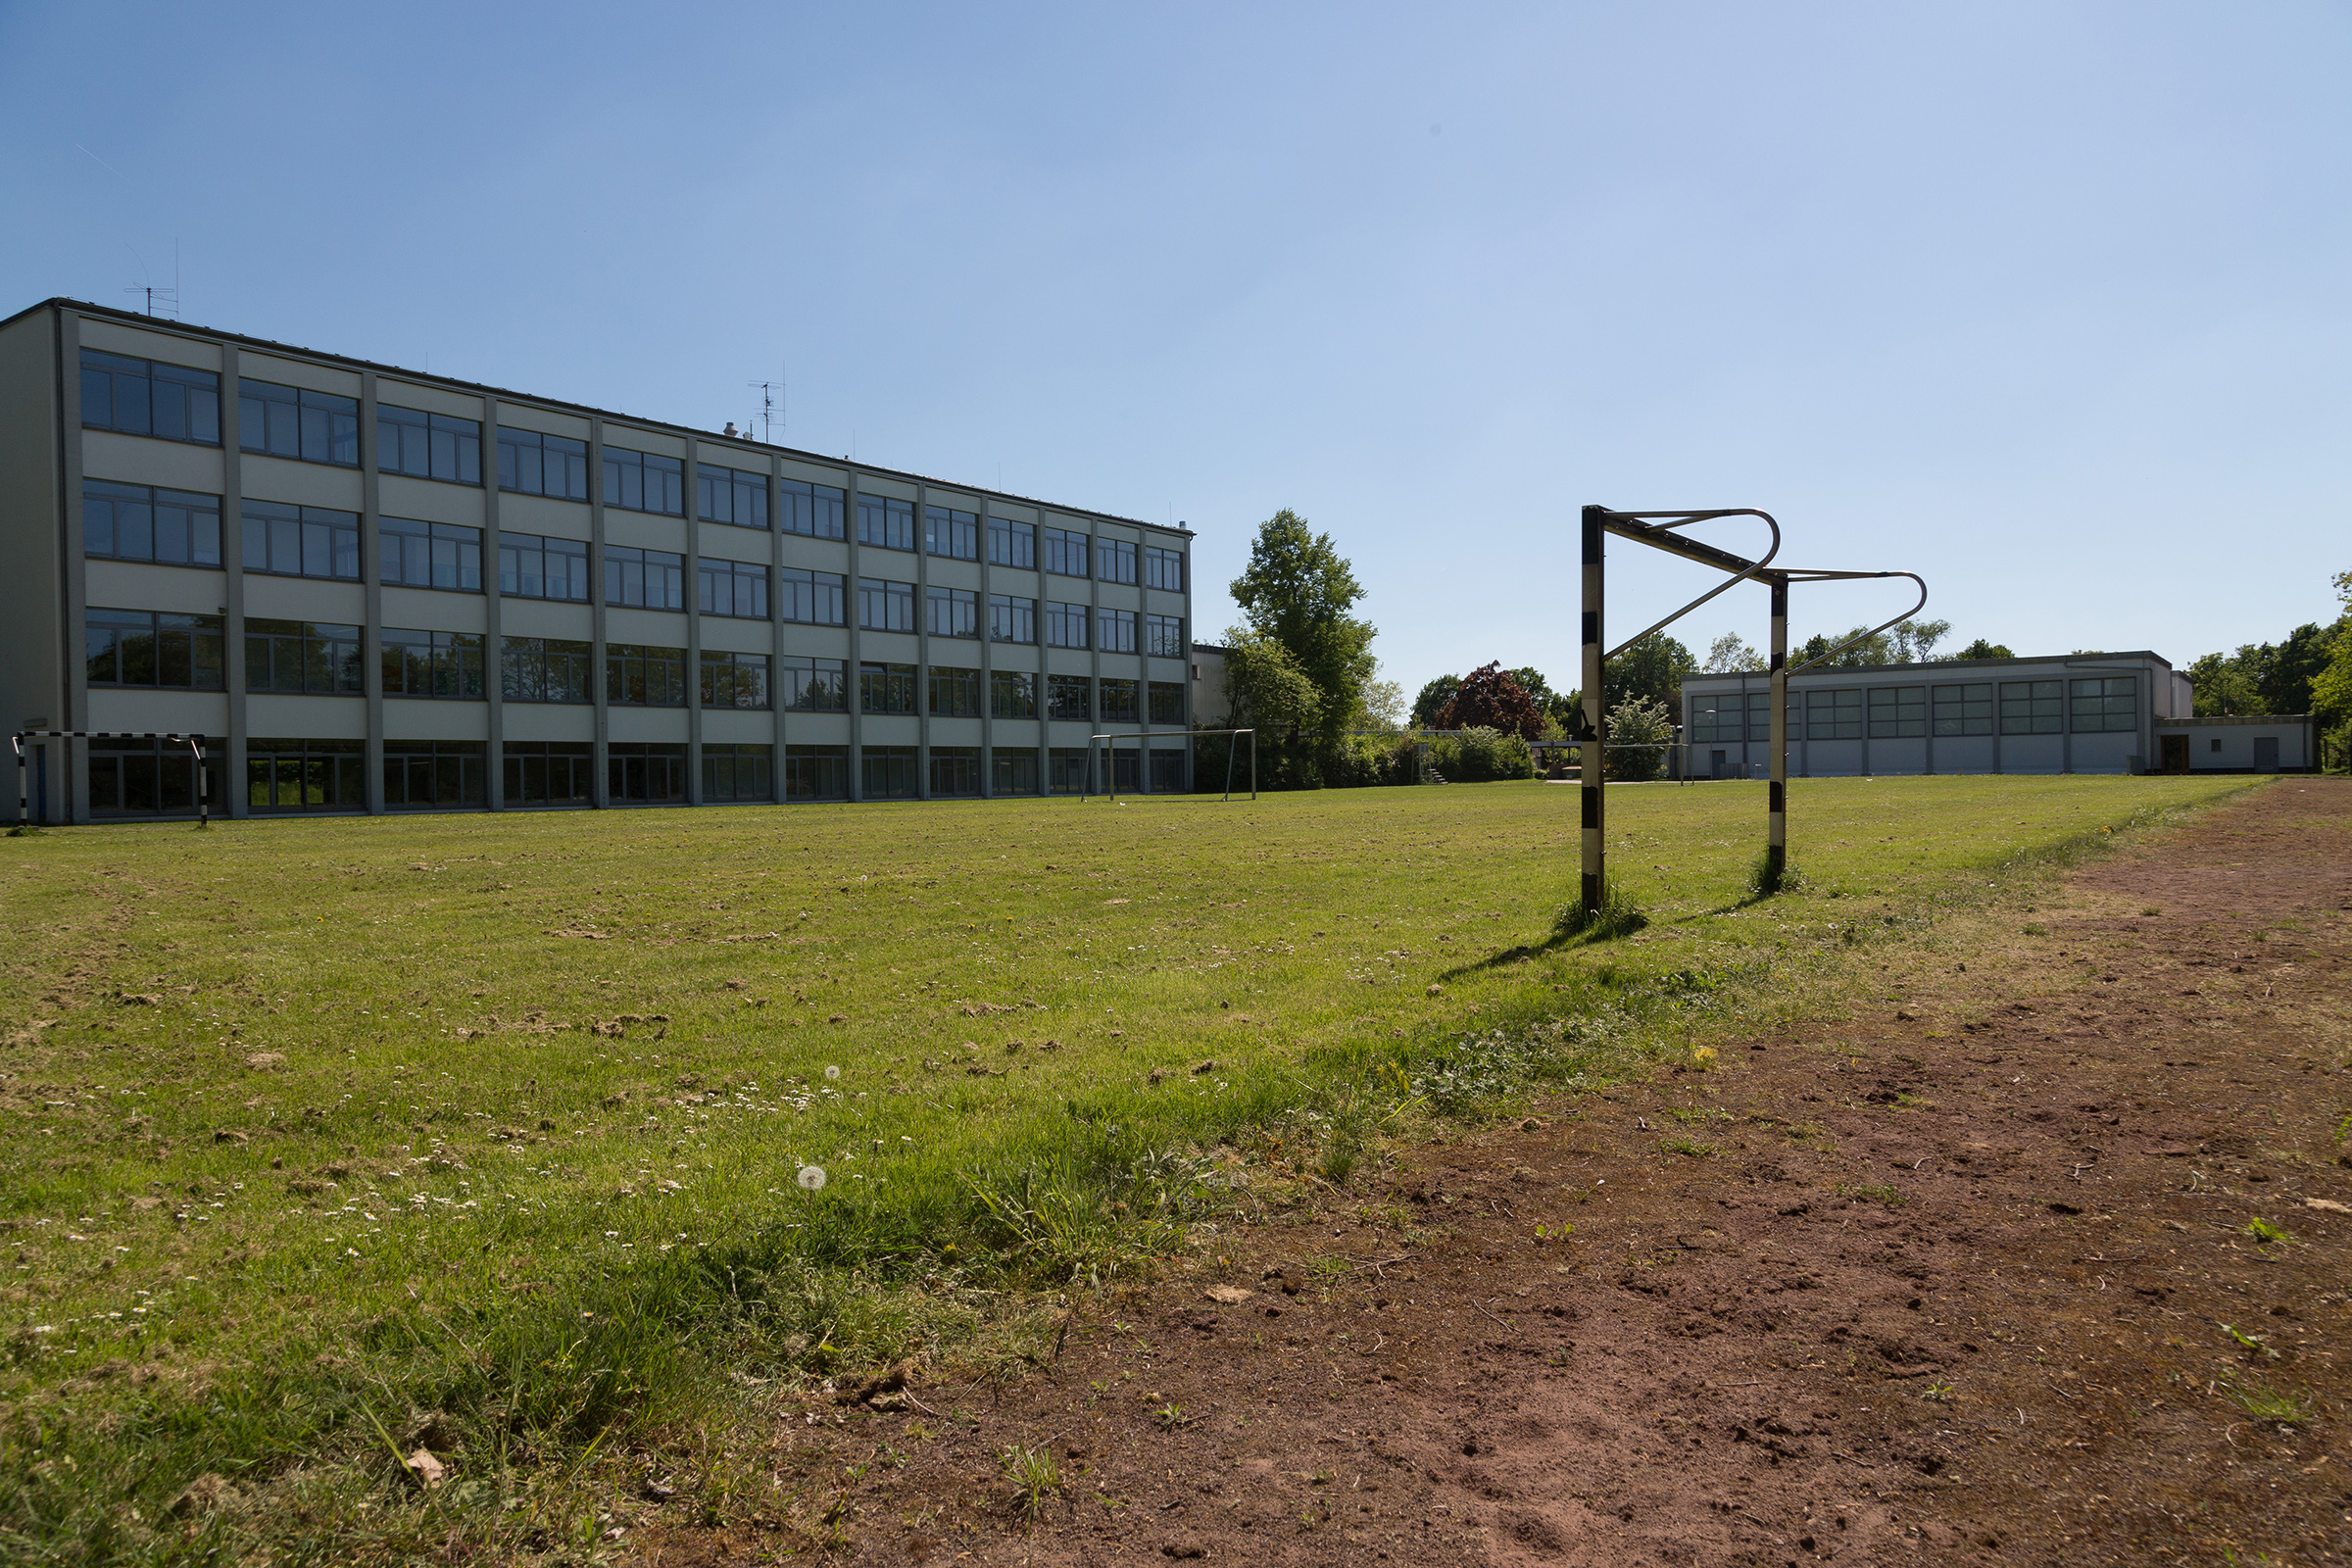
Thanks to https://unsplash.com for some of these photos used in this exercise

Test your progress after Reading the start-up document given to you

Photo1: What is urban heat island? Will you be able to draw a diagram of UHI? Point out urban canopy and boundary layer.

Photo2: Identify the location of the photo in an urban area. State three characteristics in support.

Photo3: 3a. Which part of the city it represents? 3b.State three characteristics in support. 3c.Why land values are higher in this part? What kinds of environmental stresses may emerge in this part of the city and why?

Photo4. Explain two reasons why informal economic sector is important in a megacity such as Lagos?

Managing Urban Heat Island in Singapore

Ways to deal with Urban Heat Island Effect (UHI)

Creating greener cityscape

Air Pollution: Air quality, smog and visibility

Air quality in urban areas is often poorer than in rural areas due to suspended particulates in the air mainly from power stations and vehicle exhausts. This also includes cement, dust, tobacco smoke, carbon monoxide, sulphur dioxide, ash, and pollen. Coastal cities may also have large number of sea salts. All these may produce haze, acid rain, smog (mixture of fog and smoke) etc.

Photochemical Smog:

Photochemical smog is a haze like condition that develops when pollutants like oxides of nitrogen and volatile organic compounds created from fossil fuel combustion chemically react with low level atmospheric ozone under the influence of sunlight to produce hazardous chemicals in the air also known as secondary pollutants. It decreases visibility and creates breathing troubles.

Health hazard created by photochemical smog

  • Eye irritation and respiratory trouble
  • some secondary pollutants are carcinogenic
  • Retards plant growth, damages plastics,breaks down rubber and erodes urban structures like bridges and buildings.

Mexico city and Los Angeles have a serious problem with photochemical smog because vehicle exhaust and  topographic configuration trap the high concentration of photo-oxidant gases at the low level of the atmosphere.

Temperature inversion in Mexico-city: Role of the physical landscape in trapping air pollution

Mexico city is located in a basin where cool air remains trapped by a layer of warm air above it. This is called temperature inversion. The air fails to mix and produce intense pollution effect and photochemical smog. Mexico city is one oft he most polluted places in the world

Cities with severe Air Pollution threats

Air Pollution in Delhi: Man made pollution aggravated by the physical features

Smog eater building in Mexico City

Temperature inversion trapping more pollutants

YOUR TASK

Air quality and pollution- city ranking 2023

Represent your note over the world map using MapChart

Freezing temperatures combine with coal burning and traffic fumes creates hazardous air pollution in Bishkek, the capital of Kyrgyzstan. Read the full article.

Delhi was the most polluted capital city in the world in 2020, with an average PM2.5 concentration of 84.1 micrograms per cubic meter of air (ÎĽg/mÂł). PM2.5 particulate matter concentrations in the Indian capital were almost 10 times higher than the World Health Organizations PM2.5 target of 10 ÎĽg/mÂł. The second most polluted capital city was Dhaka in Bangladesh. Many cities experienced reductions in PM2.5 pollution compared to the previous year. This was mainly due restrictions on economic activity and travel brought on by the outbreak of COVID-19. (Source: https://www.statista.com/statistics/1135356/most-polluted-countries-in-the-world/)

What are PM2.5 pollutants?

The World Health Organization advises that annual mean PM2.5 concentrations should not exceed 10 µg/m3.

Read: WHO documents on Total Dissolved Solids (TDS) in Water as an indicator of water quality testing 

According to the current UN estimate nearly one billion people live in slums worldwide. In other words, one in every eight persons on this planet currently live in urban slums. The major urban slums of the world’s are –

Kibera, Nairobi, Kenya.

Khayelitsha, Cape Town, South Africa.

Tondo, Manila, Philippines.

Dharavi, Mumbai, India.

Neza, Mexico City, Mexico.

Orangi Town, Karachi, Pakistan.

Manshiyat, Cairo, Egypt.

Where are the world’s worst slums?

Inside Rio’s Favelas

Urban Slum Kibera in Nairobi, Kenya

Deindustrialization: Negative and positive sides

Deindustrialization: Long term absolute decline in employment in the manufacturing sector (secondary sector) of an economy mainly due to increasing cost of production, massive mechanization and reduction in the labour force, increased competition and falling demand as happened in Detroit (USA) in 2000 due to falling car sales and shrinking population.

Example: Between 1978 and 1984, Detroit lost 180,000 manufacturing jobs. No industrial sector was hit as hard as the US auto industry. If the United States produced half of the world’s cars in 1960, it made just 18 percent in 1982. Detroit lacked industrial diversification. The city was largely dependent on the automobile industry and manufacturing. Its location was ideal for heavy production because of its proximity to Canada and its access to the Great Lakes.

Article Review:

Negative impacts of deindustrialization

Reliance on a single industry: the Big Three auto companies: Ford, General Motors and Chrysler experimented with automation, replacing assembly-line jobs with machinery, tens of thousands of jobs were lost. The industry shrank even more during the energy crisis in the 1970s and the economic recession in the 1980s. And foreign competition caused profits to slash down. Read more. 


Positive impacts of deindustrialization

Data driven Detroit a local cooperative focused on providing open data resources and data literacy to inform better decision-making in Detroit, Greenways Coalition is an effort to improve the safety and mobility of commuters in Detroit by connecting different neighborhoods.  NGO called Live6 Alliance are providing crucial networks, knowledge expertise, and even implementation support to small businesses to re-populate deserted commercial corridors. In addition, Google is also offering workforce development and skills training to local high school students through Code Next. Collaboration between Fortune 500 companies like Ford and Google has the potential to Detroit a hub for automotive innovation. Live6 Alliance coupled with Greenways infrastructure and investments by Fortune 500 companies promise to turn a new leaf in Detroit’s socioeconomic history. Read More

Designing sustainable Eco-cities require efficient urban housing management strategies

Masdar City is the world’s first zero-carbon city project which is being developed in Abu Dhabi, UAE. The city will completely rely on solar energy and other renewable sources for its power needs. It is expected to be completed by 2025. Click here to read more about the Masdar city project for your case study. It is being constructed by Masdar, which is a subservient to Mubadala Development Company of UAE and is being designed by British architectural firm Foster and Partners. Masdar city is also known for its driverless autonomous pod car (personal rapid transit).

BedZed: UK’s first large-scale Zero carbon sustainable community and UK’s largest eco-village in Beddington, South London, comprises 100 residential homes, office space, a college and community facilities. The design is based on environmental dimensions, with strong emphasis on roof gardens, sunlight, solar energy, reduction of energy consumption and waste water recycling. Read more

Carbon neutral eco-city design

BedZED: A carbon neutral housing management strategy

HDB public housing in Singapore

Setup Menus in Admin Panel

Login

Create an Account Back to login/register