Population distribution, change and possibilities
The current world population is around 7.5 billion. The People’s Republic of China, is the most populous country in the world today with 1.4 billion people. India, the next largest country, has around 100 million fewer people, for a population of 1.3 billion in 2017. The United States, the third largest country in the world, has a much smaller population of 323 million. Estimates show that India will surpass China as the most populous nation in the world by 2025. The population of the EU-28 countries was 505 million in 2013. Germany with 82 million people in 2017 is the most populous country in EU.
Top 10 – Ranking of countries in terms of absolute population in 2017
China – India – USA – Indonesia – Brazil, Pakistan, Nigeria, Bangladesh, Russia, Japan
Click O click Class Work:
click here to see current net population growth (births and deaths account)
Click here to see real time simulation of birth and death rate
Basic demographic information on Germany
Comparative data on the U.S. and World demography
Click here to find Interactive data on world population
Click here to see the most populated cities in China
Professor Han’s Rosling’s presentation
on the issues like fertility rate, life expectancy, child survival rate and income inequality in different countries
Sources of demographic data
http://esa.un.org/wpp/excel-data/population.htm
http://www.indexmundi.com/
https://www.cia.gov/library/publications/the-world-factbook/
http://epp.eurostat.ec.europa.eu/portal/page/portal/statistics/themes
http://data.worldbank.org/
http://www.prb.org/Publications/Datasheets/2013/2013-world-population-data-sheet/data-sheet.aspx
http://ec.europa.eu/eurostat/data/database
http://www.census.gov/population/international/data/idb/informationGateway.php
Germany’s Population Data on DeStat
https://www.destatis.de/EN/FactsFigures/SocietyState/Population/Population.html
Terms and Concepts
Demography – is the study of population
Population density – population per unit of land area; that is the number of people per square mile or people per square kilometer
Crude birth rate – the number of live births per 1,000 people in a population of a given year.
General fertility rate (Total fertility rate (TFR) ) – the average number of live births per 1,000 women of childbearing age (14-49 years) in a given year
Crude death rate – is the number of deaths per 1,000 people in a population of a given year
Rate of natural change – the difference between birthrate and death rate
Growth rate – the number of people added to (or subtracted from) a population in a year due to natural increase and net migration expressed as a percentage of the population
Sex ratio – the number of males per 100 females in a population
Morbidity – the frequency of disease, illness, injuries, and disabilities in a population
Mortality – deaths as a component of population change
Infant Mortality Rate – the number of deaths of infants under age 1 per 1,000 live births in a given year
Child mortality rate – the number of deaths of children under 5 years of age per 1000 children in a given year
Childbearing years – the reproductive age span of women, assumed for statistical purposes to be 15-49 years of age
Fecundity – is the physiological capacity of a woman to produce a child.
Child woman ratio – is the number of children under age 5 per 1,000 women aged 15-49 in a population in a given year.
Life expectancy – depicts the average number of years a person can be expected to live from birth if other demographic factors remain unchanged.
Dependency Ratio – the ratio of the economically dependent population to the productive or economically active population expressed as the ratio of the elderly people (ages 65 and older) plus the young people (under age 15) to the population in the working ages (between 15-64 years).
Older dependency ratio (ODR) – the number of people aged 65 and above for every 100 people aged 20-64 ( peak working population)
Demographic Transition – signifies the historical shift of birth and death rates from high to low levels in a population. The Demographic Transition Model was developed by the American demographer Warren Thompson in 1929. DTM depicts the demographic history of a country. It refers to the transition from high birth and death rates to low birth and death rates as a country develops from a pre-industrial to an industrialized system
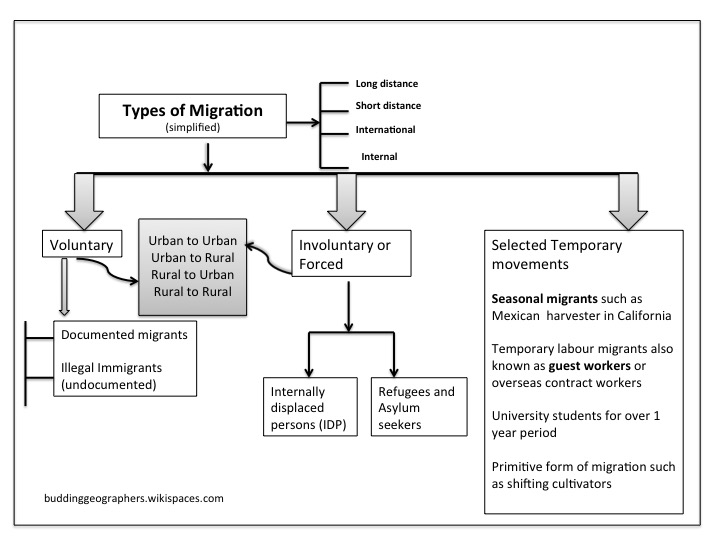
Migration – the movement of people involving a change of residence. It can be internal displacement or international, voluntary or forced. It is usually for an extended period of time (more than a year) and does not include temporary circulation such as commuting or tourism.
Emigration – the process of leaving one country to take up permanent or semi-permanent residence in another.
Brain drain – the emigration of a significant proportion of a country’s highly skilled, highly educated professional population, usually to other countries offering better economic and social opportunity
Remittances – transfer of money or goods by foreign workers to their home country
Refugee – a person fleeing their home country in order to escape danger
Asylum seekers – people who seek refugee status in another country
Illegal immigrants – people who enter another country without permission to remain there.
Internally displaced people (IDP) – those who have fled their homes but continue to live in their own country.
Doubling time – The number of years required for the population of an area to double its present size, given the current rate of population growth. The world population doubled between 1650 -1850 and 1850-1920 and 1920 -1970. Thus it is taking less time the population to double (accelerating rate of growth). 95% of the population growth is taking place in developing countries. However, the world population is expected to stabilize by 2050. The slowdown in population growth would be due to decline in fertility and an increase in the number of elderly people
Population momentum – is the tendency for a population to grow despite a fall in fertility level. On the other hand, it also includes the tendency for a population to continue to fall despite a rise in birth rate. Despite the decline in overall population growth rate, the absolute size of the human population will continue to increase over the next several decades because of population momentum. At present nearly one third of the world’s population is under 15 years of age and therefore has not yet reached the childbearing age. Because this demographic group is so large in absolute numbers, even if each woman will have fewer children than in the past, there will still be a significant increase in global population over the next several decades. Most of the population growth over the next several decades is expected to occur in developing countries, where growth rates are generally higher than developed countries. The United States is an exception, with one of the most rapidly growing populations of any developed nation.
Depopulation – The state of population decline.
Urbanization – is the growth in the proportion of a population living in urban areas.
Pronatalist Policy – the policy of a government, society, or social group to increase population growth by attempting to raise the number of births.
Antinatalist Policy – the policy of a government, society, or social group to slow population growth by attempting to limit the number of births.
Population Growth and Changes over Time
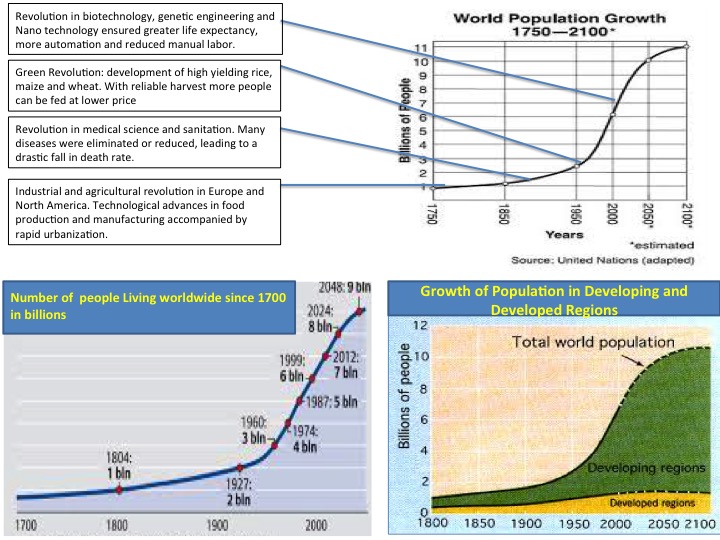
- World population reached 500 million by about 1500. It took all of human history up to the early 1800s for world population to reach 1 billion people, and until 1960 to reach 3 billion.
- The highest ever global population growth rate was reached in mid-1960s when population growth in the developing region peaked at 2.4% a year, popularly known as ‘population explosion’. By the late 1990s population growth rate had slowed down. However, population momentum drags the population growth at this period even though the fertility rate had fallen down. It took only 12 years for the world population to increase from 5 billion to 6 billion in 1999.
- Population growth rates have been falling in all regions of the world since 1990s, and this trend is predicted to continue. Current expectations are that the human population will level off at around 9.6 billion people by 2050, and will stabilize or slowly decline thereafter. According to the UN prediction, there’s an 80 percent chance that the actual number of people in 2100 will be somewhere between 9.6 to 12.3 billion (UN NewsCenter, June 2013).
- The report notes that India is expected to become the world’s largest country, passing China around 2028, when both countries will have populations of 1.45 billion. After that, India’s population will continue to grow and China’s is expected to start decreasing. Meanwhile, Nigeria’s population is expected to surpass that of the United States before 2050.
- Europe’s population is projected to decline by 14 per cent mainly due to negative population momentum, the report states. Overall, life expectancy is projected to increase in developed and developing countries in future years. At the global level, it is projected to reach 76 years in the period 2045-2050 and 82 years in 2095-2100.
Trends in Birth and Death rate in developed and developing country
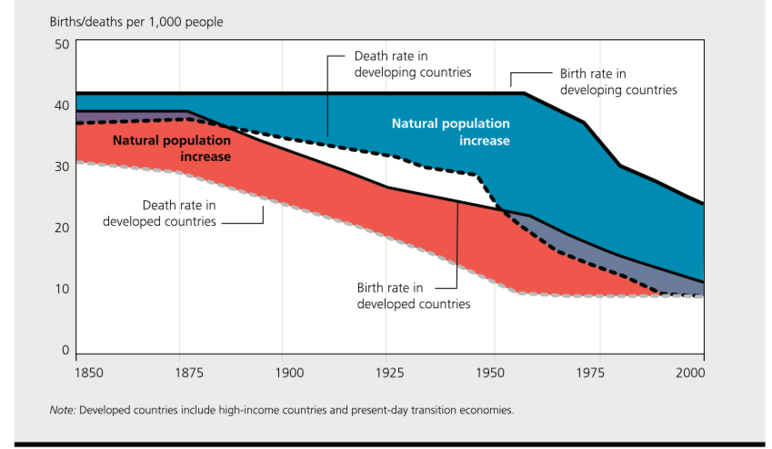 Sources: http://www.worldbank.org/depweb/english/beyond/beyondco/beg_all.pdf
Factors Affecting Population Distribution
| Physical Factors | Reasons for areas with high population density | Reasons for areas with low population density |
| Relief/ topography | population densities tend to be high in lowland areas with flat, or gently sloping terrain such as river plains. Most of the world population is concentrated in and around the coastlines, river valleys and deltas. | Mountainous areas with high altitude and steep slopes tend to have low population density due to cold climate, rare vegetation and frozen soil. For example Alps, Andes, Himalayan regions are sparsely populated. |
| Climate | Moderate climates with no extremes. Adequate rain and warm temperatures to allow crop growth. | Extreme climates very cold or very hot. For example in tundra region and in Sahara. |
| Soil | Thick fertile soils such as loam and alluvium as in Southeast England. Fertile soils are found in river flood plains, deltas and in areas of volcanic rocks such as the Ganges river plain in India, island of Java in Indonesia. | Thin, rocky and acid soils as in deserts and mountains that may only be used for extensive farming and nomadic harding, for example in North Wales in the UK and in the high Atlas mountains in Morocco. |
| Vegetation | Areas of open woodland and grassland. | Very dense jungle. ex. Amazon Basin |
| Accessibility | Coastal areas with easy access. | Interior areas with poor access, for example landlocked countries like Bhutan, Lesotho. About 40% of the population in Lesotho lives in poverty. |
| Resources | Water, timber, minerals such as coal, oil, copper, fishing and so on, for example availability of coal in the time of Industria Revolution in Western Europe had a huge impact on population density. Diamond mining town Orapa is a densely populated core area surrounded by low density areas in Botswana. | Few economic resources. ex.Sahel region in Africa |
| Human Factors | Reasons for high population density | Reasons for low population density |
| Economic | Large marketGood infrastructureAccess to imports and exportsSkilled labour forceEducation | Poor trading linksPoor infrastructureLimited job opportunities |
| Social and Cultural | Some groups of people prefer to live next to each other for security and companionship. For example the St Lawrence valley in Canada is typically populated by the French and English origin people as this was the part where the early French and English colonists settled into. | Small group of isolated people living in remote areas as in Scandinavia or small group of families living in nucleated villages with communal land in Botswana. |
| Political | Stable governmentDemocratic SystemCommercial economic systemFree market | Unstable governments and civil war as in Libya and Syria. Political Instability and conflicts between several groups such as in Yemen forcing people to migrate to safer areas. |
Low lying river floodplain and marshy land may be sparsely populated. However, some river valleys are densely populated. why?
- River valleys have fertile soil which will assure good crop yield.
- Availability of water for drinking, domestic purposes and for irrigation and livestocks.
- Easy to build settlements and transportation links like road and railway line on the river plain. Navigable river itself provides transportation opportunity and may act as a trading route.
- Fast flowing water with sufficient head may be used to produce HEP and will ensure supply of energy.
| Case Study: Uneven distribution of population in Japan | ||
| Low density rural areas | High density rural areas | High density urban areas |
Over two-thirds of Japan is mountainous and is marked by sparse population. These areas include the central part of Honsu Island and the southern part of the Shikoku Island. Very few people live here because:
|
There are mainly rural fringe of the densely populated urban areas on the flat valleys and gently sloping lower slopes of Honshu and Kyushu Islands.
Many people living in these villages are farmers while others are daily commuters to the large cities where they work. These villages are mostly very well connected and provide high quality of life. These are also the locations of the out of the town shopping mall, sports facilities that requires vast land and market gardening. |
Towns and cities stretch along the coast, particularly on the Honshu Island. Almost half of the Japan’s population lives in and around the urban conurbation of Tokyo, Nagoya and Osaka. These areas are densely populated because:
|
Population Pyramid
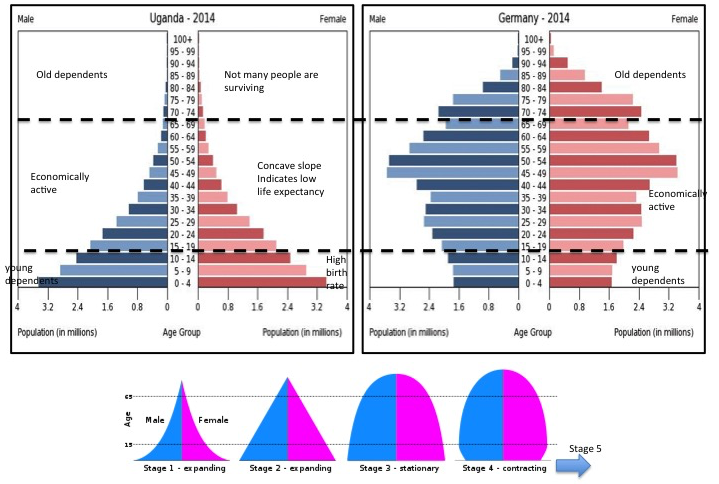
The most studied aspect of population structure are age and birth ratio. Other aspects are language, religion, ethnicity, occupation etc. Age-sex structure is conventionally illustrated by the use of population pyramid. Population pyramids are bar graphs that represent the age-sex composition of a country’s population. Each bar graph represents a five year age group apart from the top most bars which usually illustrate the population of 80 years old and above. The male population is represented to the left of the vertical axis and females to the right.
– Population pyramid can portray absolute or relative data.
– Pyramid with Absolute data- shows the figure in thousands or millions that is in absolute numbers.
– Pyramid with relative data- shows the data in percentage and allows easier comparison.
Utility of a Population Pyramid
- Illustrates the age-sex structure of the population
- It gives information about birth rate, death rate, life expectancy, male-female migration, working and dependent population
- Indicates stage of demographic transition
- demonstrate population growth pattern that helps in population projection.
- Help in demographic and economic planning- what kinds of services and facilities will be needed in future.
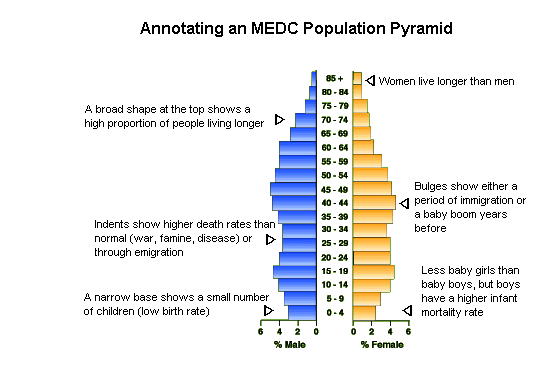
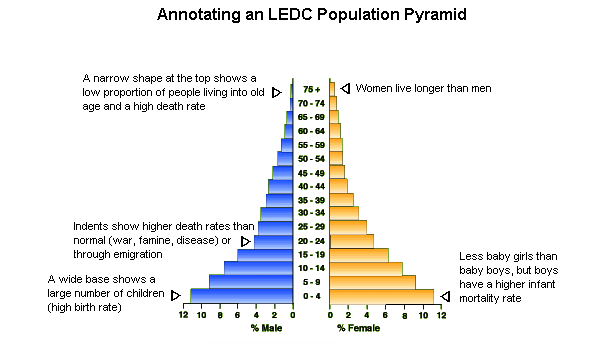
Interpreting a Population Pyramid
- A wide base suggests high birth rate
- Narrow base shows low birth rate as small numbers of children are born. Therefore, narrowing base indicates a falling birth rate.
- A broad top or wide apex indicates high proportion of people living longer.
- Straight or near vertical sides depicts a low death rate. A population pyramid that has fairly straight sides (more like a barrel) shows a population with a falling birth rate and a rising life expectancy.
- Rapidly tapering top or concave slope suggests high death rate and low life expectancy. Over time, as a country develops, the shape changes from triangular to barrel-like. Places with an aging population and a very low birth rate would have a structure that looks like an upside-down pyramid.
- A population pyramid that is very triangular (e.g. Mozambique in 2000) shows a population with a high number of young dependents and a low life expectancy.
- Bulges in the slope indicate high rate of immigration or a preceding baby boom year. This could be because of the economic migrants if the bulges are typically at the working age population group. On the other hand, if the bulges appear at the retirement age group then that can be attributed to the counter migration or returning migrant’s flow or the due to the maturity of the baby boom cohorts.
- Sudden indents at the side of the pyramid indicate higher death rates than normal may be because of a war, famine, disease (epidemic) or natural catastrophe etc.
- Deficits in slopes or distorted pattern in the same cohorts signifies gender specific out migration or sex specific death rate
Click here for the visual display of the changing population structure of the World from 1950 to 2050
Construct population pyramid using Excel
 (http://geographyfieldwork.com/Pop3.gif)
(http://geographyfieldwork.com/Pop4.gif)
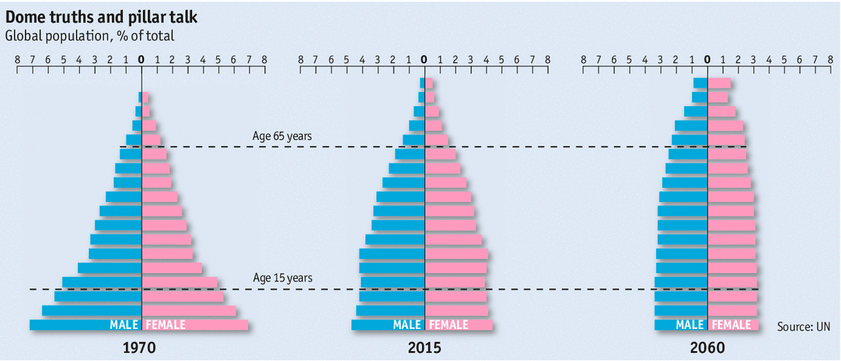 The end of population pyramid ‘The Economist‘, Nov.2014
Population Pyramids Explained
| Russia’s Shrinking Population |

Demographic Transition Model was developed by the American demographer Warren Thompson in 1929. DTM depicts the demographic history of a country.It refers to the transition from high birth and death rates to low birth and death rates as the country develops from a pre-industrial to an industrialized economic system. Click here for more on DTM
Population momentum
Population momentum refers to population growth or decline, which continues despite fertility rates falling or increasing.
Population momentum occurs towards the end of stage 3 of demographic transition. Even though the birth rate may be falling in a country, the natural increase in terms of total number may be rising due to population momentum.
- Despite the decline in overall population growth rate, the absolute size of the human population will continue to increase over the next several decades because of population momentum. At present nearly one third of the world’s population is under 15 years of age and therefore has not yet reached childbearing age. Because this demographic group is so large in absolute numbers, even if each woman has fewer children than in the past, there will still be a significant increase in global population over the next several decades. This is an example of positive population momentum.
- Most of the population growth over the next several decades is expected to occur in developing countries, where growth rates are generally higher than for developed countries. The United States is an exception, with one of the most rapidly growing populations of any developed nation
| Over population and demographic transition |
| [embedyt] https://www.youtube.com/watch?v=QsBT5EQt348[/embedyt] |
[embedyt] https://www.youtube.com/watch?v=74Cn0JfKgao[/embedyt]
Over, Optimum and Under population
is a dynamic concept, changes with time and space and as technology improves, total population changes, new discoveries and innovation enhance human capacity to resource utilization.
Human overpopulation occurs if the number of people exceeds the carrying capacity of the region means there are too many people relative to resource and technology creating pressure on the available resource endowment and thereby deteriorating the standard of living of a region.
A region or country can have low population density and still be overpopulated e.g. North eastern Brazil (23 people per sq.km) is overpopulated in respect to the carrying capacity of the region and characterized by low income, poverty, poor living condition and high level of emigration. A country may have high population density and is still able to provide for itself because of high technological and economic advancement, will not be considered as overpopulated e.g. Netherlands with 406 inhabitants per sq.km in 2014 (source: indexmundi, accessed on Oct.2015) is one of the densely populated countrys in Western Europe but is not overpopulated.
Many areas of the world are now overpopulated. The problems faced by people in the overpopulated countries are-
- Lack of raw materials, fuel, inadequate food supply and consequent starvation and conflict,.
- Lack of jobs and poverty
- Poor access to education and health care.
- Overcrowded housing, lack of space and squatter settlements.
- Traffic congestion, pollution and high level of disease
- Overused agricultural land, overgrazing, soil erosion and deforestation.
- Inadequate water supply and lack of sanitation.
What is the earth’s carrying capacity for the human population?
This question cannot be answered without considering consumption levels, and the technologies used to generate and support the consumption. The Ecological Footprint data suggest that 3 to 4 planets with the current earth’s bioproductive capacity would be required to support the current population if the whole world start consuming at the consumption level of US.
Factors Affecting (components of) Population Change
Birth rate: is the number of live births in a given period of time in per 1000 population
Fertility rate: is the average number of children born to a women in her reproductive life.
Death rate: is the number of deaths per 1,000 people in a population in a given year
Infant mortality:the number of deaths of infants under age 1 per 1,000 live births in a given year. Death rate includes infant mortality
Life expectancy: is the average age of people at death. It is the average number of years a person can be expected to live from birth.
Natural increase: is the difference between births and deaths, expressed as a rate or usually as a percentage.
Net migration = (the number of immigrants) – (the number of emigrants)
| Fertility Recent data: The world’s average fertility rate in 1980 was 3.8 children per woman, it has come down to 2.5 children per woman in 2014Countries with high fertility rate: countries in Sub Saharan Africa such as Niger (7 children per women in 2014), Mali, Burundi, UgandaCountries with very low fertility rate: Singapore (0.8 children per woman in 2014), Romania, Poland, Italy, Japan, Germany (1.4 births per woman), Spain etc |
Mortality Recent data: The world’s average mortality rate in 1980 was 10.7 deaths per 1000 population, it has come down to 7.8 deaths per 1000 population in 2014Countries with high mortality rate: countries in Sub Saharan Africa such as Chad (15 deaths per 1000 in 2014), Angola, Zambia, Rwanda, Liberia, Lesotho, South Africa, Ukraine in 2014 Countries with very low mortality rate: Qatar (1.5 deaths per 1000 in 2014), UAE, Kuwait, Singapore, Oman etc |
Migration Recent data: In 2013, the total number of international migrants worldwide reached 232 million, up from 154 million in 1990. Europe and Asia host the largest number of international migrants. Remittances to developing countries reached US$435 billion in 2014. Excluding China, remittances significantly exceeded foreign direct investment flow to developing countries and is 3 times larger than official developmental aid (ODA) in 2014 (World Bank Data). |
|||
| Reasons for high birth rate in LEDCs | Reasons for low birth rate in many MEDCs | Reasons for high death rate | Reasons for low death rate | Factors affecting the flow of migration | |
| To counter high infant mortality rate. For example: Afganisthan registers 117 deaths of infants per 1000 live births, Mali (104 infant’s death per 1000), Somalia, Chad, Niger, Nigeria records high infant mortality in 2014 and all these countries are also marked by high birth rate. | Better nutrition and advanced medical care ensure low infant mortality | Poverty, poor nutrition, lack of clean water and sanitation associated with low level of economic development Such as in Lesotho (14.9 deaths per 1000), Somalia, and Mali. | Good living condition and personal hygiene, supply of safe drinking water, access to advanced medical care | Push Factors:
Pull Factors:
|
|
| Primary sector based rural economy where children are considered as economic asset and are likely to work on farms | Urban life style, lack of time, career pursuit and high cost of living restraint people to have more babies | Ageing population: countries with high percentage of elderly population seems to have high death rate such as iGermany (11 deaths per 1000), Belgium, Austria etc. | Large youthful population as in most of the Middle East countries like Qatar, UAE, Bahrain. | ||
| Children are considered as social security and are likely to look after their parents | Parents do not require children to look after them. Old age security is assured by medical insurance and other old age support system for example Robots to performs domestic work in Japan | Heart disease and strokes and cancer are the major causes of deaths in MEDcs. For example in USA. While Respiratory disease like pneumonia, tuberculosis and parasitic disease like malaria take great death toll in LEDCs. In Russia (13.8 per 1000) one of the major causes of death is alcohol consumption | Increased food supply, better nutrition and healthy diet. | Examples
IDPs– Syria, Colombia, Pakistan, Yemen and Ukraine, have registered high number of IDPs in 2014 mainly due to civil war and political unrest. The conflict between Colombian government and armed Marxist guerillas that began in 1960 have left over 3 million people as homeless in their own country |
Examples
Better job opportunity-more than 80% of the migrants in UK during the last decade were male and between 15-44 years of age. |
| Lack of family planning knowledge and poor medical facilities such as little availability and awareness of contraception, no access to abortion. | Female emancipation, late marriage and career pursuit prevent them to have more children | Civil wars and conflicts as in Ethiopia, Syria, Ukraine. South Africa (17 deaths per 1000 in 2014) and Ukraine (16 deaths per 1000) recorded highest death rate in 2014 due to civil war and conflicts. |
Decline in infant and child mortality. Globally infant mortality has decreased from 63 deaths per 1000 live births to 34 deaths per 1000 births in 2013 | Illegal immigrants to USA:There were about 11 million unauthorized immigrants in US in 2012. Mexican make up about half of the unauthorized immigrants in USA mainly in California, Texas, Florida (5% of U.S. labour force) | Immigrants constitute very high % of the population: Qatar (72%), Monaco (64%), Brunai (49%) Singapore (42%), Australia (27%), Canada (21%) in 2013. The reason behind this is mainly economic. |
| Ineffective government policy | Low response to pro natal birth policiey | Transport related accidents and natural disaster are common cause of deaths in many African countries | Romania has by far the largest number of emigrants per million populations to OECD countries. | China was the top country for immigration into OECD countries followed by Poland. | |
| Cultural and religious tradition that oppose family planning and contraception | Better knowledge of and access to contraception and other family planning measures | Prevalence of HIV. For example HIV related death was highest in Nigeria, South Africa and in India during the last five years | |||
| Traditional gender role and tradition of women to stay at home and to bear child | Socio-cultural maladies like high suicide rate as in Japan. Suicide rate in Japan, South Korea, Nepal and India is 50% higher than the world average Suicide rate can also increase due to socio-economic stress as in Greece (death rate- 11 deaths per 1000 in 2014). Study reveals that austerity in Greece has led to tragic 35% increase in suicide in recent years |
Most favored destination of immigration: with 45 million migrants in 2014, USA is the most favored destination of immigration followed by Germany (nearly 10 million immigrant), Saudi Arabia, UK (7 million), France, Canada, and Australia (6 million). | |||
| Early marriages in some society | High infant and child mortality in some countries like Afganisthan (117 deaths der 1000 live births) | ||||
| Data source: CIA World Fact Book, 2014, EST, World Bank Data 2015, WHO 2014 | |||||
Life Expectancy at Birth
Life expectancy denotes the average number of years a person is expected to live at birth if the current mortality conditions remain unchanged throughout the rest of the life. Life expectancy at birth is the commonly used indicator for analyzing mortality.
WHO Statistics, 2014
According to WHO statistics 2014, people everywhere are living longer. Global average life expectancy has increased by 6 years from 1990. Low-income countries have made the greatest progress, with an average increase in life expectancy by 9 years from 1990 to 2012.The top six countries where life expectancy increased the most were Liberia, which saw a 20-year increase (from 42 years in 1990 to 62 years in 2012) followed by Ethiopia (from 45 to 64 years), Maldives (58 to 77 years). The gender gap is also shrinking. Newly born women in MEDCs are expected to outlive men by 5.5 years.
Countries with high life expectancy in 2014: Japan (), Iceland, Spain, Switzerland, Singapore, Israel, Sweden, Luxembourg. All these countries register life expectancy of over 80 years of age at birth.
Countries with low life expectancy in 2014: Sierra Leone, Congo, Lesotho, Somalia, Swaziland, Angola, Chad, Mali, Burundi, Cameroon. All these countries record life expectancy of below 55 years of age at birth.
Factors affecting Life Expectancy
- Size of the elderly population reaching the end of their life cycle and on mortality rates.
- Advances in healthcare and medicine including reduced infant mortality.
- Economic development and improved quality of life, better sanitation, access to clean and safe drinking water.
- Environmental conditions like less pollution, more greenery reducing the risk of cancer and respiratory diseases.
- Healthy and sustainable lifestyle reducing the risk of coronary diseases.
- General level of education that unplugs wide choices and awareness
- Frequency of catastrophic natural hazards and community preparedness to deal with. For example more than 90% of the population of Bangladesh, Nepal, Burundi, Haiti, Taiwan, live in areas at high relative risk of death from two or more hazards.


Migration
Migration is the permanent change of residence with a complete change of community ties. However, very recent definitions also consider certain temporary movements as migration (refer unesco.org). Migration does not include daily commuting to work, shifting of house in the same neighbourhood and tourism.
Migrations are broadly classified as
- Involuntary (forced) and Voluntary migration
- Long distance and Short distance migration
- International and Internal migration
- Return migration.
 Top Immigrant Countries of the World
Accounts on migration and recent statistics, 2015
See People-on-the-move- Amnesty International
Syria’s refugee crisis in numbers
The UN Refugee Agency (UNHCR)
| Illegal Immigrants in US | European Refugee Crisis and Syria | Myth of European immigration 2016 |

| Syrian Refugee crisis: live coverage of a risky jouney | |
Article review :
Migration to Europe explained in BBC article
Must read on Gender ratio_Washington post article 2015
Theories of Migration download
Dependent and Working population
Dependency Ratio indicates the relationship between of the economically dependent population to the productive or economically active population. It is expressed as the ratio of the elderly people (aged 65 and older) plus the youthful population (under age 15) to the population in the working ages (16-64). Aging population are usually a product of longer life expectancy and lower birth rate.
Older dependency ratio (ODR) – the number of people aged 65 and above for every 100 people aged 16-64 (working population).
| Dependency ratio = Youthful Population ( 0-16 age group) + Elderly population (population over 64) Working population (16-64 age group) |
| The higher the dependency ratio, the greater the economic pressure on the working population to pay more taxes. |
Juvenility index =
Population between 0-16 age group
Population above 16 years
The higher the juvenility index, the greater the proportion of youthful population in a country.
Older dependency ratio (ODR) =
Non-economically active population (over 65)
Working population (16 -64 age group)
Consequences of Youthful and Ageing Population: Problems and Possibilities
| Youthful Population Countries with high % of youthful population in 2014: Countries of sub-Saharan Africa and the Middle East. More than 45% of the population is youthful in Niger, Uganda, Mali, Zambia, Burundi, South Sudan. All these countries register very low median age of population ranging between 15-17 years of age. In absolute numbers, India has the world’s largest youth population. |
|
| Problems (negative aspects / disadvantages) | Possibilities (positive aspects / advantages) |
| Large youthful population will demand more food. Strain on food supply can cause overgrazing and over cultivation, which in turn may lead to desertification. Many sub-Saharan African countries such as Mali, Nigeria and especially the semi-arid transition region of Sahel witnessed devastation as a result of human misuse of the land. Hundreds of thousands died of starvation. The growth rate of population in this region (3% per year) exceeds the growth rate of food production (2% per year). Overgrazing and poor agricultural practices lead to soil erosion and further degradation of the land. | Large youthful population provides the country with a chance to build an educated and skilled manpower for the future. This large cheap future workforce may act as an engine of growth for the entire economy. |
| It creates pressure on the existing resources and strains the education, health services, food supplies and accommodation availabilities. Government has to build special types of infrastructures to cater to the need of the youthful population such as availability of enough immunizations,providing schools and teachers, sports facilities and good public transport system. | Provides a growing market for the manufactured and consumer products. A country with a large youthful population may become a destination for foreign direct investment (FDI) apprehending a large consumer base in future as the young population enters into the working age. Young people are also the target group of the large MNCs selling consumer durables like play stations and mobile phones or global food chain like MacDonald, Starbucks. Consumer culture spreads faster in youthful generation. |
| Rural areas may become unable to sustain the growing young population and this would possibly cause rural to urban migration. Overcrowding in towns and cities could lead to shantytowns, poverty and lower standard of living. Need for more physical space would create ecological destruction. | Countries with a large base of youthful population and comparatively well developed health care system like Qatar, Saudi Arabia register lower death rate. |
| Economic pressure on the working population to support the young dependents. It may results into more taxation to raise government revenue to be able to spend for the necessary infrastructure development. On the other hand, schools, collages, sports facilities etc. may also become expensive due to rapid increase in demand. | If the country is able to grow and create jobs for the growing youths, it will provide a large tax base for the country in future. |
| Having a high proportion of youthful population means more competition in the job market and lack of availability of jobs in the future if the economy of the country fails to grow at a suitable pace by creating new opportunities for the young generation. Scarcity of employment opportunities may lead to social unrest as in North African region and in Greece. 25% of the work force in Greece was unemployed in 2014. | Innovation and revolutionary ideas may surge into the society. For example, the rise of Arab Spring (mass popular protest against the dictatorial law and order situation, unemployment, corruption and rising prices in the Arab world) is closely related to the demographic configuration of the Arab world. Nearly 60% of the population across the Arab world is under the age of 30 and are free of the fear that held back their parents. Protesters in Jordon and Morocco wanted transition to constitutional monarchy, People in republican regime like Egypt and Tunisia overthrew the corrupted president and called for free election. |
| Political instability, conflict and even civil war may erupt in the country if the government is unable to maintain and control the growing population such as in Djibouti (54% of the workforce is unemployed), Congo (46%), Angola (26%), Tunisia and Syria (15%). | |
| Youthful population tends to register higher crime rate like vandalism, robbery, graffiti and burglary etc. Researches show that unemployed youths tend to join terrorist groups or in underworld activities as in Afghanistan. | |
| More female adults may stay out of the work force to take care of the children. | |
| Ageing Population Countries with high % of elderly population in 2014: Japan and west European countries like Monaco, Germany, Italy, Austria with a median age of over 40 years. Elderly population constitute 17% of the total population in Germany. By 2060 nearly 40% of the population in Japan will be over 65 years of age |
|
| Problems (Negative aspects) | Possibilities (positive aspects) |
| Pressure on working population, as they have to pay higher taxes to support the pension budget. Working population and the government have to support and cater to the need of the elderly population. Budget deficit will climb higher and higher as pensioners collect their retirement and medical benefits, all to be paid by a shrinking core of taxpayers. | Elderly people are a crucial part of the community and they contribute both knowledge and experiences useful to train the young generation. In certain skilled based industries like watch making, education, consultancy services elderly people are more valued over younger generation by the employer because of their valuable experiences and acquired skills. |
| Increased government spending on health care and pensions. Higher savings for pensions may reduce capital investment. More money needs to be spent on specialized health care, building of hospitals, old care homes and other specialized services for the elderly like wheelchair ramp on the buses and trains etc. This will reduce the scope of productive investment in education, research and in building up of economic infrastructures. This may cause trade deficit in future. | A significant portion of the ageing population in Europe, Australia and Canada are still physically and mentally much healthier than their preceding generation and are willing to work and contribute to tax revenue. In 2007 Germany raised its retirement age from 65 to 67 and the German government is now thinking about increasing the retirement age to 69 for full pension payments to start. |
| As older people do not work but demands several services, there will be a crunch of workers. Reduced supply of workers leads to increase in wages. This will delay the retirement age of the people as in Germany and will cause more immigration. With nearly 10 million immigrants in 2014, Germany has become the 2nd most preferred destination for the immigrants after the USA. | In MEDCs with an ageing demographic structure, elderly people are often viewed as an important market for certain types of products, known as ‘grey economy’. This may range from holiday companies, healthcare provider to hair color. Retirement migration to coastal resorts in Europe created a higher demand for specialist housing and services. This has helped to regenerate the remote rural areas from declining. |
| There will be less people to defend country and defense system will be more automated, expensive and destructive. | Voluntary services are a measure of social capital and an indication of a healthy society (Bittman 2002). Elderly people aid their families with childcare and find satisfaction in providing charitable services. Therefore, elderly people helps to built-up social capital. |
| Lack of innovation | A society with elderly population tends to register lower crime rate. |
| Reduced demand for manufactured and consumer goods. Industries migrate overseas for cheaper young labor creating trade deficit. | Art and culture benefits from an educated elderly population. The older generation in MEDCs are actively involved in community clubs and libraries. They also attend classical musical concerts, theater and art galleries more frequently than younger people. |
| The elderly may also have some unique and largely forgotten traditional skills to pass on to the younger generation. For example, the granny women in Southern Appalachian in the USA are the healers and midwives for the rural and secluded Appalachian community. | |
Click here for the Map of World with Youthful population in 2014
Click here for the Map of the World with Elderly Population in 2014
Read the UN report on aging population 2015
Japan’s rapidly greying population
The population of Japan is estimated at 126,999,808 as of July 1 2014.
Japan’s population is equivalent to 1.75% of the total population of the world.
The population density in Japan is 336 people per Km2.
93% of the population is urban (117,995,650 people in 2014).
The median age in Japan is 46.2 years.
- The number of people aged 65 or over rose by 1.1 million to 33 million and now outnumber those aged 14 or younger by two to one.
- The demographic shift is due to a combination of a low birthrate and long life expectancy.
- The country has very little immigration. Any suggestion of opening its border to young workers who could help to plug the population gap provokes strong reactions among the public.
- Japan population is predicted to drop to some 87 million by 2060 with the proportion of the elderly people aged over 65 and over estimated to reach 40% of the total.
Comparison of dependent population
| Dependency ratio | Japan’s dependency ratio | Germany’s dependency ratio | India’s dependency ratio |
| Total dependency ratio: Youth dependency Elderly dependency Potential support ratio |
63.3 % 21.2 % 42.1 % 2.4 |
52.1 % 19.8 % 32.3 % 3.1 |
52 % 39.7 % 12.3 % 8.1 |
| Source: indexmundi demographic profile 2014 |
| Japan’s aging population | |
Why is Uganda’s population so youthful?
Youth in Uganda are the youngest population in the world, with 77% of its population being under 30 years of age
A youthful population is defined as a population that has a high proportion of young people (0-14 years of age) due to high birth rates and a decrease in infant mortality. Children are young dependents on the working population.
The high fertility may be due to: children being considered as assets in LEDCs especially for parents who work in the primary sector, lack of education for women about family planning, less access to contraception, religious forbidding for the use of contraception and a high infant mortality rate for which the high birth rate compensates.
The death rate in Uganda however has fallen rapidly in recent years: This is largely due to UNICEF’s global program, which helps to provide children with vaccinations against common infections, improved treatment for Malaria and other medical breakthrough.
The youthful population of Uganda (Ugandans aged 15 or below) stood at 19 million out of a population of 35 million. Many Ugandans are having access to safe water and to an improved sanitation system thereby mortality rate has also decreased. On the other hand, people also compensated for by having more children because of a lack of confidence that their children would survive infancy, thereby creating high fertility rate.
The problems of youthful populations
Economic
Economic burden on tax payers and more government spending for suitable infrastructure development like schools, sports facilities, public transport etc.
Increased unemployment in future if new jobs are not created which may lead to more competition for jobs, increased poverty, conflict and civil unrest
Ecological
Overall shortage of limited finite resources. Over exploitation of agricultural land for more food production and consequent deforestation, soil erosion, desertification and overall depletion of resources.
Socio-cultural
Migration, overcrowding in large cities, in LEDCs shantytowns may start to grow at the city edges, there could be lowering of living standard and a rising crime rate. An increasing population can cause water and land pollution.
Positive sides:
Large manpower for the future that may act as an engine of growth for the economy. Large market for consumer products.
Lower death rate and more innovations in the society.
Issues related to youthful population
| Uganda (an LEDC) in 2014 | Japan (an MEDC) in 2014 | |
| Total population | 35 million in Uganda of which 48% is youthful (0-14) in 2014 | 127 million people only 13% is youthful (0-14) |
| Median age | 16 years | 46 years |
| Birth rate | 44 births per 1000 population | 8 births per 1000 |
| Life expectancy | 53 years | 84 years |
| Fertility rate | 5.9 children per woman | 1.4 children per woman |
| Death rate | 11 deaths per 1000 | 9 deaths per 1000 |
| Infant mortality rate | 61 deaths per 1000 live births | 2 deaths per 1000 live births |
source: indexmundi country profile
What is Maternal Mortality?
Death of a woman while pregnant or within 42 days of termination of pregnancy, from any cause related to or aggravated by the pregnancy or its management, but not from accidental causes (WHO).
Maternal mortality rate (MMR): is the number of maternal deaths in a population divided by the number of women of reproductive age, usually expressed per 1,000 women.
In 2013, 289 000 women died during and following pregnancy and childbirth. Almost all of these deaths occurred in low-resource settings, and most could have been prevented.
Biological causes of maternal mortality aggregated by the poor medical infrastructure and unavailability of trained medical personnel.
Women die as a result of complications during and following pregnancy and childbirth. Most of these complications develop during pregnancy. Other complications may exist before pregnancy but are worsened during pregnancy. The major complications that account for nearly 75% of all maternal deaths are:
- Severe bleeding (mostly bleeding after childbirth)- haemorhage
- Infections (usually after childbirth)
- Obstructed labour – dystocia is a difficult child labour may cause nerve damage and respiratory problems.
- High blood pressure during pregnancy (eclampsia)
- Complications during and from delivery
- Unsafe abortion.
- The risk of maternal mortality is highest for adolescent girls under 15 years old
Key data on MMR – World Health Organization
- Every day, approximately 800 women die from preventable causes related to pregnancy and childbirth.
- 99% of all maternal deaths occur in developing countries.
- Maternal mortality is higher in women living in rural areas and among poorer communities.
- Young adolescents face a higher risk of complications and death as a result of pregnancy than older women.
- Skilled care before, during and after childbirth can save the lives of women and newborn babies.
- Between 1990 and 2013, maternal mortality worldwide dropped by almost 50%.
Relationship of MMR to other key socio-economic indicators
- The higher the GDP per capita (based on purchasing power parity), lower is the MMR
- The higher is the GFR (the number of live births per 1,000 women aged 15-49 in a given year), higher is the MMR
- The higher is the percentage of births attended by skilled health personnel (doctor, nurse or midwife), lower is the MMR
Disparity between LEDCs and MEDCs in MMR
Almost all maternal deaths (99%) occur in LEDCs due to inequalities in the access to health services, and because of the huge gap between rich and poor. More than half of these deaths occur in sub-Saharan Africa and almost one third occur in South Asia.
Major reasons of high MMR in some countries: Why do women not get the care they need?
Poverty
– Malnutrition
– Lack of access to good health care
Inadequate health care services
– Lack of trained health personnel. Only 46% of women in low-income countries benefit from skilled care during childbirth6. This means that millions of births are not assisted by a midwife, a doctor or a trained nurse.
Higher fertility rate:
– Birth spacing: Women in developing countries have on average many more pregnancies than women in developed countries, and their lifetime risk of death due to pregnancy is higher.
Distance
– Remoteness- poor women in remote areas are the least likely to receive adequate health care.
Lack of information and knowledge
– Cultural practices and religious beliefs
– Age of mothers
– Lower status to women
Population Policy
Click here to read more on one family one child policy of china from 1979-2015
Class Works on Infographics
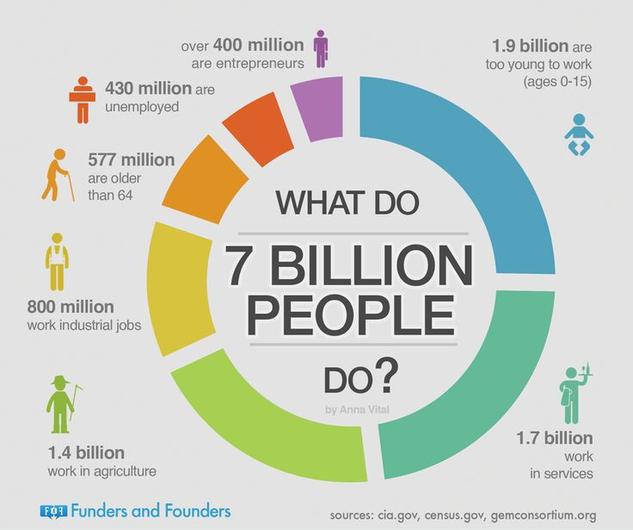
1. Interpret the following infographic to describe the composition of the dependent and working population in the World
2. Interpret the linked infographics in selected groups. Each group will have only two minutes time to memorize and then each team needs to create their own infographics by putting in the information they could memorize as a team. Finally each group needs to explain the content of the infographics according to their understanding in front of the other groups.
3. Create your own Infographic: Click on this link to create your own infographic. Use Random picker to select topic.
IGCSE Question Bank: Examples of exam type questions with answer keys
Suggest three ways in which a population pyramid for an LEDC is likely to be different from that of an MEDC.
- LEDC population pyramid will have narrower apex (tapering top) indicating higher death rate particularly in the elderly age group (70+). Therefore it will be more pyramidal shaped than MEDC population pyramid.
- It is less likely to have bulges in the economically active group (16-64 age groups) in LEDC population pyramid as emigration tends to be larger than immigration in LEDC.
- LEDC population pyramid will exhibit concave slope indicating relatively high death rate and low life expectancy.
Explain how death rates have been reduced in NICs (newly industrialized country), such as in Philippines, Malaysia, Brazil, India,Thailand, Turkey. OR suggest reasons for the large increase in the percentage of the population over the age of 65 which is expected in Indonesia and Malaysia by 2025.
- Availability of better treatment of diseases with greater access to necessary medicines and medical research. Greater access to vaccinations, inoculations and immunization has increased survival rate and reduced child mortality.
- Improved health care facilities with modernized hospitals and clinics. People have access to regular check-ups. Many of the NICs like Thailand, Singapore, India have become the new medical hub of the world offering good quality treatment at a much cheaper price than MEDCs. Economic growth and large taxpayer base helped the governments to invest in Old care homes and services for elderly.
- Most of these NICs have qualified man power to ensure sufficient supply of doctors and nurses
- Better water supplies, improved diet and increased efficient food production have ensured healthy and better living standard.
- Better sanitation and hygiene awareness have improved living environment
- Pensions and other economic support from government has helped to reduce stress
- Awareness and greater use of contraception has helped to reduce STDs and HIV
- Better preparedness for natural disasters and efficient disaster response system has helped to reduce catastrophic death.
Explain why, in LEDCs such as Uganda young dependents make up a large percentage of the population/ reasons for high birth rate in LEDCs OR Suggest three reasons why the birth rate is higher in Pakistan (an LEDC) than Australia (an MEDC).
- To counter high infant mortality rate. People tend to have more children in the hope that some will survive. For example in Sierra Leone (107 deaths per 1000 live births), Angola, Mali, Somalia register very high infant mortality rate also record high fertility rate.
- Primary sector based rural economy where children are considered as economic asset and are likely to work on land, perform domestic work like looking after younger children or collect water; fuel wood etc and are likely to send out to earn money for the family.
- Lack of family planning and poor medical facilities such as no access to abortion, little availability and awareness of contraception or other birth control measures.
- Children are considered as social security as they are likely to look after their parents in old age.
- Ineffective government policy
- Cultural and religious tradition like desire for a son to perform certain rituals, certain religion like Islam and Roman Catholic Church oppose contraception.
- Traditional gender role and tradition of women to stay at home and bear children exacerbated by early marriages in some society.
Explain why the governments of MEDCs, such as the Germany, Japan, are concerned about the ageing population.
- see problems of aging population
Class Work
Demographic data that you should know
Click here to recent data on Infant Mortality
Click here for the Map of World showing Life Expectancy at Birth
Click here to see the list of countries with highest infant mortality in the world
Article Review:
Click here to read article on countries with most polluted air
Read article on countries most likely to go belly up
Fun Learning
Are you a demographer?_ Ined_quiz
Population Quiz_theguardian
Biggest Countries by Population_quiz
Population Quiz for IGCSE
Match the flashcards_population quiz
Game: Factors of migration
Millionaire game on demography
Population game level 1
Level 2 : http://www.superteachertools.us/millionaire/millionaire.php?gamefile=2024
Level2: http://www.superteachertools.us/millionaire/millionaire.php?gamefile=2042